

Market expects rate cuts. The US Federal Reserve has ruled out rate cuts this year. However, failure of more smaller banks could lead to rapid emergency easing of rates by the Fed.
Summary
The US Federal Reserve has maintained a moderately hawkish tone and ruled out any interest rate cuts this year. The markets, however, have a different view and seem ready to call the Fed’s bluff. At least, the one thing that the markets and the Fed agree on – no more dramatic increases in interest rates from here.
Over, the last two weeks, the shock of Silicon Valley Bank’s (SVB) failure, delivered a massive blow to the US short-term interest rate markets. Just over three weeks ago, the two-year US Treasury yield was +5.1%, it dipped to +3.7% last week and this morning, the yield stands at +4.15%. These moves provide another example of something that’s “broken” in the aftermath of the Fed’s most aggressive tightening cycle in forty years.
The Fed is banking on generalized strength, a robust economic backdrop, as well as systemically important US banks having robust balance sheets (unlike the holes they had in 2008), in order to stay on its rate path.
However, any broadening of the turmoil in US banking sector due to the failure of more smaller banks, that cuts credit expansion and jams economic activity, could lead to rapid emergency easing by the central bank. Fed Funds futures tend to under-shoot policy rates at inflexion points. In other words, they price too few hikes during tightening cycles (we saw that this cycle too), and too few cuts during easing cycles i.e. you could see well over 100bps rate cuts this year.
For now, however, US economic activity is not collapsing, and growth is still positive. Therefore, the S&P 500 continues to stay in the range it has been in for the last six months, while the Nasdaq has also outperformed.
I continue to be risk positive and even though I expect interest rate cuts this year, a no-rate-cut outcome, wouldn’t bother me, if the economy grows well and rate cuts were delayed for that reason.
US Fed stays hawkish…markets don’t care
US Federal Reserve Chair Jerome Powell to Mr Market: “[FOMC] participants don’t see rate cuts this year. They just don’t. Rate cuts are not in our base case.”
Mr Market to Chair Powell: “Yes you are cutting rates this year.”
On March 22, the Federal Open Market Committee (FOMC) of the US Federal Reserve (Fed) approved another +0.25% increase in interest rate. This is the Fed’s ninth consecutive rate increase and brings its benchmark Federal Funds rate to a range between +4.75% and +5%, the highest level since September 2007.
The Fed changed the language regarding the outlook for future rate hikes, replacing “ongoing increases in the target range will” be appropriate, with “some additional policy firming may” be appropriate. The Fed, however, maintained a moderately hawkish tone and ruled out any rate cuts this year.
The markets, however, seem to have a different view. As the chart below shows, the markets seem ready to call the Fed’s bluff on rate cuts this year.
Current market pricing reflects a +0.75% to +1.00% interest rate cut by December. The Fed Fund Futures market is pricing in more than a full 25 bps cut, by the July meeting. This is despite Chair Powell’s and the FOMC’s repeated insistence not to expect a rate cut this year. I’ve been in the financial markets since 2004, I can’t remember a time when there was more of a disconnect between what the Fed is forecasting and what the market is expecting.
At least, the one thing that the markets and the Fed agree on – no more dramatic increases in rates from here. The Summary of Economic Projections (SEP) released by the FOMC reflected that view, with the median Fed Funds forecast for this year unchanged at +5.125% i.e. close to the current upper bound of +5%.
Implied Overnight Fed Funds policy rate and Number of Hikes/Cuts

Source: Bloomberg
Over, the last two weeks, the shock of Silicon Valley Bank’s (SVB) failure, delivered a massive blow to the short-term interest rate markets.
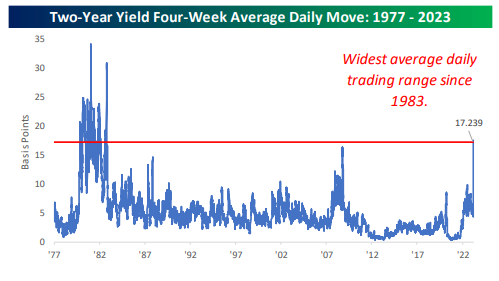
Traditionally, the 2-Year Treasury has been one of the least volatile areas of financial markets, but over the last month, the average daily move in the two-year yield, has been over +17 basis points (bps), the most volatile trading since 1983. Many days saw yields fall by over 50 bps, intraday.
Just over three weeks ago, the two-year yield was +5.1%, it dipped to +3.7% last week and this morning, the yield stands at +4.15%.
We are talking about a US Treasury bond here and not the price of Adele concert tickets!
These moves provide another example of something that’s “broken” in the aftermath of the Fed’s most aggressive tightening cycle in forty years.
Source: Bespoke Invest
The Fed is banking on generalized strength, a robust economic backdrop as well as systemically important US banks having robust balance sheets (unlike the holes they had in 2008), in order to stay on its rate path. A broadening mess in the US banking sector, due to the failure of numerous smaller banks, that cuts credit expansion and jams economic activity, could lead to rapid emergency easing.
Powell emphasized the uncertainty, saying the banking situation “could have very modest effects” on the economy, while also noting the opposite could also be true, thereby leaving the door open for rate moderation. Powell created clear grounds for changing the trajectory of policy conditional on broader pain in the banking sector hitting the real economy.
Small banks play a crucial role in the US economy and, if they fold, the big banks couldn’t fill the gap quickly enough (let alone fill it over time). Small and medium banks account for about 50% of US commercial and industrial lending, 60% of total residential lending, about 80% of total commercial real estate lending, and about 45% of total consumer lending in the US.
The easiest way the Fed can contain regional banks from folding, is by moderating rates lower over time.
The post-Covid world has already reduced the need for commercial real estate, as many employees choose to work from home. Businesses that have still kept office space, in the hope of using it in the future, will have to think hard. If rates stay high, as leases come up for renewal, they may just not be renewed, leaving a stack of non-performing loans on the books of the regional banks. This will force the Fed’s hand very quickly.
On Friday after the close, the Federal Reserve released its weekly snapshot of national bank balance sheets for the week ending March 15, capturing the failure of SVB and Signature Bank. The report shows evidence of deposits flowing away from smaller banks and towards large banks, which is a concern that could imperil regional banks more generally. Large banks saw deposits rise $67bn. Small banks lost $120bn in deposits (the most ever, and a 2.2% decline, the second-largest ever). As for loan growth, the data showed no slowdown for the week across lending categories. That may come later, but at least credit creation hasn’t yet ground to a halt.
Historically, Fed Funds futures tend to under-shoot policy rates at inflexion points. In other words, they price too few hikes during tightening cycles (we saw that this cycle too), and too few cuts during easing cycles i.e. you could see well over 100bps rate cuts this year.
Regular readers of this newsletter will know that I do not see inflation as a problem. On the contrary, disinflation will be a bigger problem, as was the case pre-Covid. Also, given the level of debt in the US economy, a Fed Funds Rate higher than +3 to +3.5%, is unsustainable over the medium to long term.
Markets and the Economy
The key event since last month’s newsletter, is the collapse of SVB, the second-biggest bank failure in US history, with total assets and deposits equalling $212 billion and $173 billion, respectively.
SVB failed because the bank’s management did not effectively manage its interest rate and liquidity risks, and the bank then suffered a devastating and unexpected run by its uninsured depositors, in less than 24 hours. Welcome to the other benefits of online banking – bank runs will happen not at the gates of bank branches, but overnight when branches are closed. Vast sums moved with a few taps on a smartphone.
SVB failed on March 10, 2023. The S&P 500 index is up + 5% since that day.
This “banking crisis” is not your 2008 crisis or Lehman 2.0, as alarmists like to call it. Back then, it was not just a liquidity but also a solvency crisis. Systemically important large US banks were undercapitalised and had too much bad debt on their books. The Fed and lawmakers were slow to realise this problem.
Bear Stearns went under on March 16, 2008, and it was almost 7-month later that the Troubled Asset Relief Program (TARP) – to help stabilize the US financial system, restart economic growth, and prevent avoidable foreclosures – was signed into law by President George W. Bush on October 3, 2008. The first allocation of TARP money was primarily used to buy preferred stock and proved ineffective in stalling the contagion.
On November 12, 2008, US Treasury Secretary Hank Paulson indicated that reviving the securitization market for consumer credit would be a new priority, in the second allotment of TARP and on December 19, 2008, Bush used his executive authority to declare that TARP funds could be spent on any program that Paulson deemed necessary, to alleviate the financial crisis. It was only then that the crisis abated. The hesitation and delay meant S&P 500 index (SPX) kept falling and between March and November 2008, the SPX was down over -40%.
This time around, the systemically important US banks are well capitalised, rules bar them from holding risky assets on their balance sheet (proprietary trading) and the Fed, the Federal Deposit Insurance Commission (FDIC) and the US Treasury, moved quickly in a coordinated fashion, to limit the contagion by guaranteeing all SVB deposits and extending additional support to all banks. Economic activity is not collapsing, and growth is still positive.
Therefore the SPX continues to stay in the range it has been in for the last six months (chart below), while the Nasdaq has also outperformed
1-year price chart: The S&P 500 Index

Source: Bloomberg
There’s another reason why the SPX has held up so well over the last six months – the market is underinvested in equities – as confirmed by the Bank of America (BofA) Fund Managers Survey (FMS) report.
The cash allocation in the report stands above +5.2% in February 2023, whilst the historical average is +4.7%. The cash allocation has remained above the historical average since December 2021.
As rates have risen, cash/deposits have become an alternative but there hasn’t been equity capitulation (chart below from Michael Hartnett of BofA Research)
Data compiled by BofA Research indicate that:
- Since December 2019, there has been a cumulative inflow of $1.6tn into cash, $1.3tn into equities, $440bn into Investment Grade bonds, and $270bn into US Treasuries i.e. in the 2020s, cash has become an alternative
- But there hasn’t been equity capitulation thus far. For every $100 of inflow during the last Bull market, no outflow has happened during the current bear market (vs $113 outflow during the GFC of 2008, $53 outflow during the Eurozone Debt Crisis of 2012 and $61 outflow during Covid-19)
- As you can see, the equity line in the chart below has flatlined since last April– i.e. no net inflow/outflow for over 12 months.
The dry powder packed in deposits will start flowing into equities and other risk assets as we come to the end of the hiking cycle, risk factors abate and sentiments improve.
Yesterday, BofA reported that its client flows to US equities posted their biggest week since October, adding that they bought both single stocks and ETFs, with bigger inflows into stocks. BofA clients were net buyers of US equities for the fourth straight week. BofA is the second largest prime broker, hence their client flows offer useful insights into market sentiments.
Cumulative flows by asset class since December 2019

Meanwhile, the sentiment regarding Emerging Market equities, is already a lot better and keeps improving.
Chinese equities have recouped nearly half their recent losses and the news that Alibaba would likely split into 6 groups- brought additional cheer, with BABA up +10% on the day. The break-up of Alibaba will help unlock value.
The reorganization of one of China’s largest private companies, once valued at more than $800 billion but now worth about a third of that, comes after Chinese authorities signalled in recent months they were winding down a sweeping regulatory clampdown aimed at reining in the country’s powerful tech sector. The return of the government’s supportive stance toward China’s private enterprises is very welcome news.
After more than a decade abroad, Alibaba’s co-founder Jack Ma was spotted back in China on Monday, a co-incidence only if you don’t know how China works. It will be interesting to see if another coincidence is soon announced – Ant’s IPO. Bet on it.
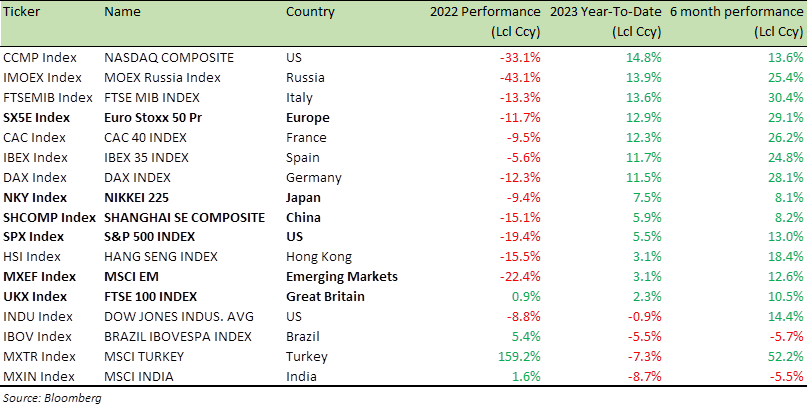
Benchmark Global Equity Index Performance (2022, 2023 YTD and 6 months)
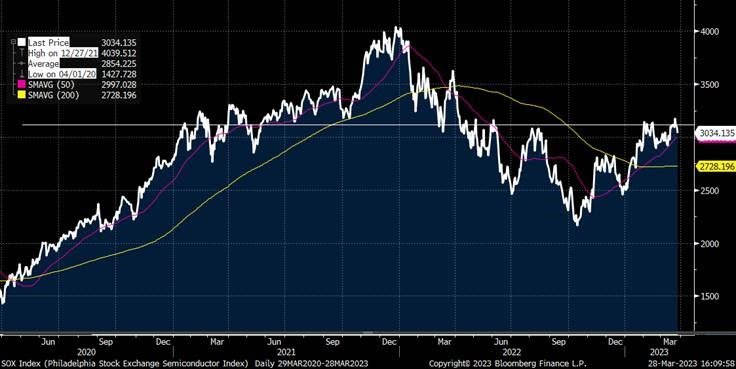
If you are in the pessimist camp, there’s a lot not to like about the market these days, but the performance of the semiconductors, has been an area of optimism.
Last week, the Philadelphia Semiconductor Index (SOX) broke out of a sideways trading range and is not far from its 52-week highs. This, with only 47% of stocks above the 50-day moving average, i.e. there’s more upside to this ETF.
Much of the strength in the semis has been attributed to NVIDIA (NVDA), which has been on fire this year, rallying more than +80% on the explosion of AI-related interest.
Semiconductor stocks, long seen as a cyclical play, may be turning into a secular growth story, particularly if the AI-driven revolution stacks up well over the next few years. One to watch.
3-Year Price chart: The Philadelphia Stock Exchange Semiconductor Index (SOX)
Source: Bloomberg
Another stock-specific news, which indicates earnings are not as weak as some anticipate.
Last week, Nike (NKE), announced a dramatic fiscal Q3 revenue beat of +8% alongside adjusted and diluted EPS +46% higher than forecast. North America and EMEA both grew more than +20% on a constant currency basis thanks to spectacular results in footwear, especially. Very few wanted NKE at $80, now everyone will want it at $120.
Warrant Buffet once said, “be fearful when others are greedy, and greedy when others are fearful.”
At Crossbridge, we chose to be greedy when others were fearful and launched the following product in November 2022 which has an attractive +15.6% coupon, with a Leveraged Put.: 5 Year 15.6% p.a. Decreasing Trigger on Nike, Disney, Pepsi, and Constellation.
The note is currently trading at 101.03, with a carry (coupon) accruing as the product progresses.
My point? You do not have to have a bullish view in order to invest. The beauty of a structured product, is you can “create a product” to suit the prevailing and forecasted outlook.
As I keep reiterating – Structured Products are a very useful means of investing in equities. They offer a degree of capital protection, while at the same time helping pick good entry points in the market, and offering means to clip coupons, in a flat to negative market.
For specific stock recommendations and Structured Product ideas, please do not hesitate to contact me or your Relationship Manager.
I continue to be risk positive and even though I expect rate cuts this year, a no-rate-cut outcome, wouldn’t bother me if the economy grows well and rate cuts were delayed for that reason.
Pessimism makes for stories and WhatsApp forwards, but unattractive for portfolio returns.
If you have a medium to long-term investment strategy and you don’t use leverage then you have little to worry about and build your portfolio with the right selection of products and structures. We are here to help. So, please do get in touch.
Best wishes,

Manish Singh, CFA