

Inflation peaked last June. The Fed risks killing “aggregate demand” if it doesn’t change course on rates.
Summary
The “Inflationists” won the inflation debate in November 2021, but their victory was “transitory”, as US inflation peaked seven months later in June 2022, at +9.1%. It currently sits at +6.4%, annualising at +3.2% over the last seven months. The US Federal Reserve’s effort to cool inflation, is not only working, but has worked its way through to the point where the focus should now shift from inflation to growth.
Raising interest rates further could easily sacrifice “aggregate demand” and kill the US economy’s clearest bright spot in recent years—a strong job market. A recession leading to inevitable rate cuts would undo the progress made so far by the Fed in coming out of “zero rates.” It would be better to focus on the medium-term trend in data, than to panic with one print which is above expectations.
We all should take heart that in Fed Chair, Jerome Powell we have a person who is less academic and more practical, thus well suited to ignoring the baying mob and staying focused on economic growth, just as much as inflation, and seeing through the “transitory” impact of Covid-19 on the inflation numbers.
We are in the favourite part of the US Presidential cycle. The third year of a Presidential cycle tends to be the most bullish for US equity markets, with a median return of +17% with positive returns an incredible 95% of the time. It’s no surprise then that the equity markets have held up well over the last two months. Easing inflation and seasonality both doing their job to keep getting the dip buyers at every opportunity. Melt-up (with some sideways moves) is the trade, whether the equity bears like it or not.
“Inflationists” won the inflation debate in 2021, but…
Over the past 12 months, as the US Federal Funds Target Rate (FDTR) climbed to +4.75% from +0.25%, inflation sparked a furious debate that turned into an obsession within the commentariat.
Between March and November 2021, the US Consumer Price Index (CPI) rose from +2% (the US Federal Reserve’s target inflation rate), to +6.5%.
At the November 22, 2021, Federal Open Market Committee (FOMC) meeting, Fed Chair, Jerome Powell announced that the Fed would stop characterizing the high US CPI prints as “transitory.” The inflationists, led by the likes of former US Treasury Secretary Larry Summers, took a victory lap, and rightly so.
The “Inflationists” won the inflation debate, but their victory was “transitory,” as US inflation peaked seven months later in June 2022, at +9.1%. It currently sits at +6.4% (annualising at +3.2% over the last seven months – a lengthy enough timeframe to reach such a conclusion.)
The November 2021 announcement by the Fed, was largely symbolic, as the Fed’s job is to manage “expectations.” You don’t expect a central bank to be alarming in its communication. It leaves that to politicians and the talking heads on television, who love sensationalism more than rationalism, and rarely, if ever, have “skin in the game.”
We are now almost in the Spring of 2023. Inflations peaked eight months ago and since then, inflation has been coming down steadily, yet some continue to agitate for a higher Fed Funds Rate.
As recently as last week, Summers doubled down by saying, “the Federal Reserve’s efforts to cool inflation aren’t working as well as hoped.”
I would say:
- US CPI is down from +9.1% to +6.4% (and annualising at +3.2% over the past seven months)
- The US yield curve has inverted to an extent not seen in the last 40 years
- The risk of a recession is rising
- Goods prices are in disinflation
- Housing starts have declined for nine months in a row
All the above, are signs that the Fed’s effort to cool inflation, is not only working, but has worked its way through to the point where the focus should now shift from inflation to growth.
The Fed has raised short-term rates to such a high level that the spread between 2 year and 10 year Treasurys (chart below) at -86 bps, is at a worse level than the one observed in 1987 (Russian default, Asian financial crisis, Long Term Capital Management(LTCM) collapse), in 2000 (the Dotcom crisis) and in 2007-08 (the Great Financial Crisis).
US Treasury 10-year yield minus US Treasury 2-year yield
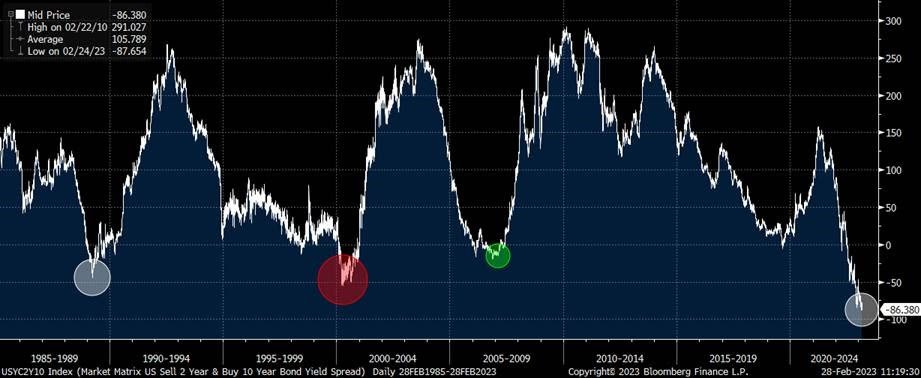
Source: Bloomberg
Besides, there’s more to the headline CPI number than meets the eye. So, let’s take a closer look at the CPI data:
- The core goods inflation is already negative, and volatile energy prices have collapsed. The only thing keeping headline CPI high is “shelter”. Shelter makes up 34% of the US CPI basket and remains stubbornly high at over +9%. However, crucially, the shelter data lags the actual housing/rental market data by 8-12 months
- The CPI ex-shelter data (chart below) is already in disinflation. as of June 2022 to the current data. From June 2022 to January 2023, CPI ex-shelter, is annualising at i.e. -1.6% p.a. i.e. disinflation
US Consumer Price Index (all items, ex-shelter)
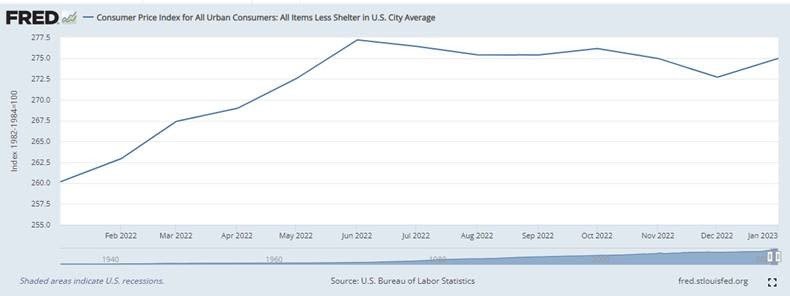
Source: US Bureau of Labour Statistics (BLS)
So, “shelter” should peak and roll over during the March -June 2023 period.
What happens to headline CPI data once its largest component normalises/ goes negative, as the current rental data indicates? Disinflation is the answer. The Fed knows “disinflation” is what it will have deal with for years to come, and it has set in already.
If this is not a sign that the Fed has done enough and the focus should stay on growth, then I don’t know what is. Thankfully, the Fed is not run by the likes of Summers, else we’d be in an economic depression now, due to policies to combat “inflation” brought on by transitionary factors.
Regular readers of this Newsletter will recall my concern that “disinflation” is where we are headed, and the short bout of inflation we have seen, is the result of Covid-19 and the accompanying fiscal spending.
Those still demanding the 1970s “Volcker shock” ought to read this newly published paper. The researchers at the Fed have concluded that Covid caused a “demand reallocation shock,” not a startling conclusion you might say. What’s more interesting is this – the reallocation shock “is able to explain a large portion—3.5 percentage points—of the increase in US inflation, post-pandemic.”
Covid-19 didn’t lead to an increase in “aggregate demand” to a new level. It shrunk “aggregate supply,” as fewer goods were made globally, due to Covid-induced disruptions. As restrictions eased, supply has caught up and inflation declined. Why then still this obsession with inflation you might wonder, even as there’s plenty of evidence that inflation has peaked. There’s a simple explanation.
Last time the world worried about inflation, was in the 1980s when the then Fed Chair Paul Volcker raised rates to +20% to curtail inflation plunging the US economy into its worst recession since the end of World War II. For much of the last four decades, inflation has taken less of macroeconomists’ and policy analysts’ time, so much so, that they are now in danger of overdoing it with their prescription to deal with a short-term burst in inflation.
However, could the inflationists force the Fed’s hands to take interest rates to +6%?
The probability of this happening is low, however, I wouldn’t bet against it, as the market did force the Fed’s hand in June last year.
Last June, as the CPI vaulted to +9.1% and the inflation-is-here-to-stay noise grew, the Fed hiked rates by 75 bps (after hiking 50 bps in May). It was the first of four 75 bps hikes last year. It’s worth noting that the CPI has been in decline ever since that June print.
What I am certain about is that if the Fed Funds Rate gets to +6%, the rate cuts that ensue will be much deeper than currently anticipated – most likely over 200 bps when the cuts start.
Data released on Friday by the US Commerce Department indicate that the Fed’s preferred inflation gauge—the Personal-Consumption Expenditures (PCE) price index—rose +5.4% in January from a year earlier. The PCE core index, which excludes food and energy and is seen as a better predictor of future inflation, rose by +4.7%.
Both readings, were on the higher side of the market’s expectations, so expect the clamour for a 50bps hike at the next Fed meeting on March 14 to grow.
Markets will continue to be in panic mode with every data that prints hotter than expectations.
Importantly, the Fed doesn’t expect inflation to slow down quickly, and they’ve already said so. The Fed’s Q4 2023 core PCE inflation forecast is +3.5% y/y which is very achievable.
The core PCE with new rent data (swapping in new rents for all rents using the Zillow and Apartment List numbers) is already at +3.4% i.e. the Fed will not be in panic mode and they have started using “disinflation” in communication and have guided for a 25bps increase.
We all should take heart that, in Powell, we have a person who is less academic and more practical, thus well suited to ignoring the baying mob and staying focused on economic growth just as much as inflation and seeing through the “transitory” impact of Covid-19 on the CPI prints.
In my opinion, the Fed will see through the noise in the January data. Besides, the Fed has only just locked in one 25bps hike given the language change in its last statements “in determining the extent of the future increase in the target range, the committee will take into account the cumulative tightening of monetary policy, the lags with which monetary policy affects economic activity and inflation and economic and financial developments.”
As the chart below indicates, whatever the quibbling and noise in the data, disinflation in core CPI (left hand side) and the PCE (right hand side) is happening.
Core US Consumer Price index (CPI), & core Personal Consumption Expenditure (PCE)
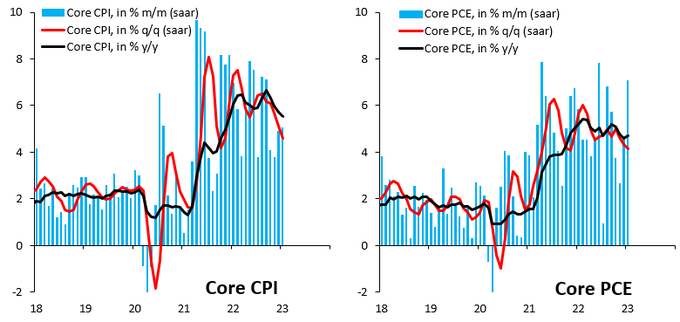
Source: Robin Brooks, Institute of International Finance (IIF)
Raising rates further could easily sacrifice “aggregate demand” and kill the US economy’s clearest bright spot in recent years—a strong job market that is delivering higher gains to low – and moderate-wage workers. If the “transitory” inflation of the past 20 months forces the Fed to push the economy into a recession, then it would undo the progress made so far by the Fed in coming out of “zero rates.”
Melt-up (with some sideways moves) is the trade, whether the equity bears like it or not. That’s the reason the S&P 500 has held up so well in face of better-than-expected US Jobs report, a higher headline CPI report and better than expected Retail sales number. It’s better to focus on the medium-term trend in data than to panic with one print which is above expectations.
Markets and the Economy
Did the S&P 500’s (SPX) closing low in October last year, mark the start of a new bull market (20%+ rally on a closing basis without a -20% decline in-between)?
From the Bear’s perspective, it hasn’t been a convincing rally. More than four months past the October lows, the SPX is only up +10.8%, and its maximum gain was +16.9%. Here we are 135 days removed from that October low, and the SPX still hasn’t reached the +20% threshold for a bull market. The Bears do have a point, even if it’s purely observational. To find a bull market, where it took the SPX longer to reach the +20% bull market threshold, one must go back to 1962. The ten bull markets between then and now all reached the +20% point faster.
I am reminded of what the great pragmatist and former Chinese leader Deng Xiaoping, famously said, “it doesn’t matter if a cat is black or white, so long as it catches mice.”
So, as someone who believes we are in an uptrend in SPX, it doesn’t matter if the number of days to get to +20% is 140 days or 200 days, so long as the trend continues and the market keeps ticking up with some sideways consolidation.
Take a look at the chart below. There’s little doubt that the downtrend in place for much of last year has been broken (a very constructive development from a technical perspective) for well over four months, and we are in a steady rally. A well-defined short-term uptrend is in place for the SPX.
The 50-day and 200-day moving averages have held up well. In technical analysis, we like to say “old resistance becomes new support” and we’ve seen a great deal of that since last October.
The economic data backdrop looks steady, as PMI data around the world has started to perk up, China’s reopening offers the hope of a further normalization of supply chains and global activity, and central banks globally seem to be nearing peak hawkishness for the cycle.
S&P 500 Index – 12-month price chart
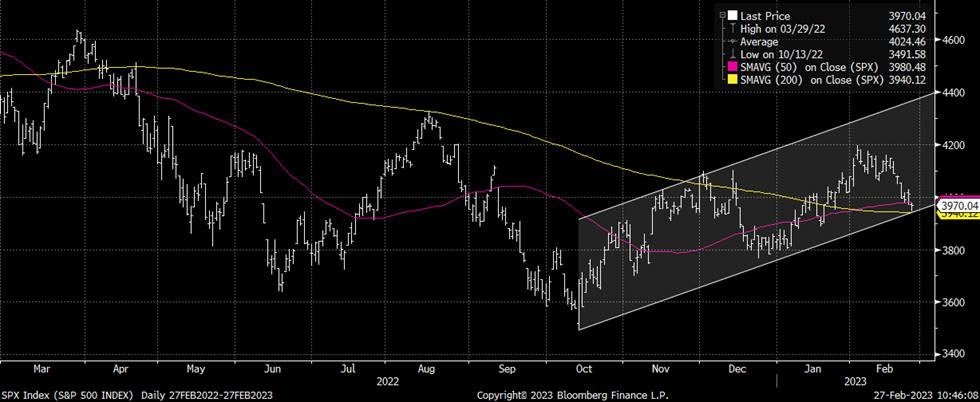
Source: Bloomberg
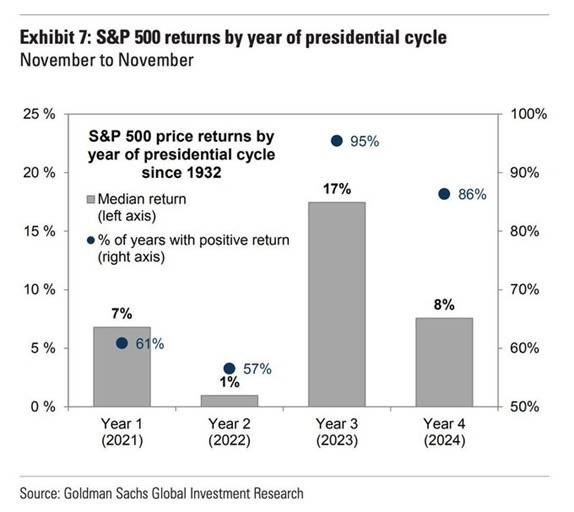
You may be sick of politics and political shenanigans. You may not be interested in voting for either the Democrats or the Republicans. However, if you are holding US equities, then you can’t ignore the statistics during the third year of the US Presidential cycle.
We are in the favourite part of the Presidential cycle. As the chart below from Goldman Sachs research indicates – the third year of a Presidential cycle tends to be the most bullish for US equity markets, with a median return of +17% with positive returns positive an incredible 95% of the time. Intuitively, this makes sense, as US Presidents begin eyeing re-election in the third year of their first term, and promote growth and market-friendly policies to boost their chances of re-election.
Whatever the reason, going back to 1932, when Democrat Franklin D. Roosevelt defeated Republican Herbert Hoover in the race for the White House, the stock market performance in the third year of the Presidential cycle has been impressive. This is a statistic that mustn’t be ignored.
A key point that the table below doesn’t indicate yet is significant:
- The first six months of the third cycle year have averaged a gain of +12.6%, with all 18 of the returns being positive. The second half of the third year has averaged a much softer return of +3.93%. So, if you are still waiting for that market drop then you’ve missed the Jan month impressive return and you might miss the whole of H1 if you don’t act fast
And if you are wondering how the third year performed, after stocks suffered in the prior year? Then the stats are even more impressive.
- The third year of the cycle has seen a big bounce-back. In the eight years that the second year of the cycle was negative for the SPX, the third year averaged a gain of nearly +25%, with all eight returns positive. By comparison, after a positive second year in the cycle, the index averaged a gain of approximately +10% in the third year with a positive return 80% of the time.
It’s no surprise then that the equity markets have held up well over the last two months. Easing inflation and seasonality both doing their job, to keep getting the dip buyers at every opportunity.
What’s even more impressive is the performance of Chinese equities, as China has fully re-opened after the Covid lockdown. China’s central bank, the People’s Bank of China (PBoC), is injecting a record amount of liquidity (chart below) into the market. On the 15th of this month, the contents of President Xi Jinping’s speech at China’s central economic work conference in December last year, were published in the party journal, Qiushi.
Titled “Several Major Issues in Current Economic Work”, the speech emphasises on expanding domestic consumption – “Prioritize the recovery and expansion of domestic consumption this year… consumer credit support should be reasonably increased .. the need to innovate consumption scenarios, and fully release consumption potential. The need to increase the consumption capacity of low and middle-income residents who have a high propensity to consume but are greatly affected by the epidemic. Rolling out policies aimed at stimulating spending on housing and unlocking consumer savings.”
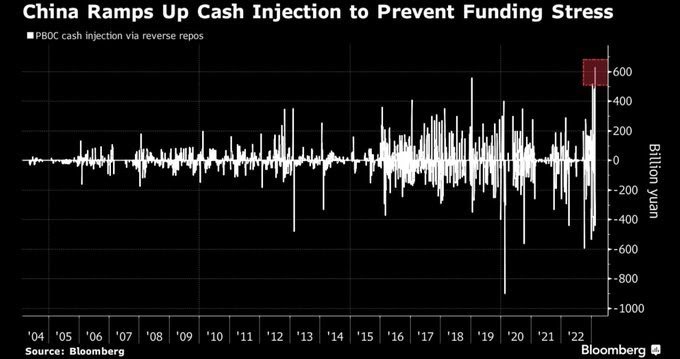
Source: Bloomberg
Unlocking consumer savings is the crucial point. According to figures from the PBoC, Chinese savers had bank deposits totalling US$2.6 trillion in 2022, up a whopping +80% from 2021.
It also bodes well for Chinese equities.
Post-Covid China is a very different China and it is amped for plenty of growth and change. A growing China, with a larger consumer base bodes well for the European economy, particularly one which counts China as its major export destination.
Joe Ngai, Chairman of McKinsey & Co. Greater China put it best – “if China’s GDP grows at a conservative +2% annually for the next 10 years, the total cumulative growth will be equal to India’s GDP today. If China’s GDP grows at +5%, the total cumulative growth for the next 10 years will be equal to todays’ GDPs of India, Japan and Indonesia are put together. If you are looking for growth the answer is very simple – the next China is China.”
It’s not just China that is easing, but Japan too.
The market is failing to consider the scale of easing/liquidity injection in both China and Japan, the second and the third largest economies in the world, respectively.
After an equity market correction of -63% from February 2021 to October 2022, Chinese equities are up +53% since their October lows and the Chinese Yuan is stronger by +7%,
More economic growth lies ahead.
Benchmark Global Equity Index Performance (2022, 2023 YTD and 3 months)
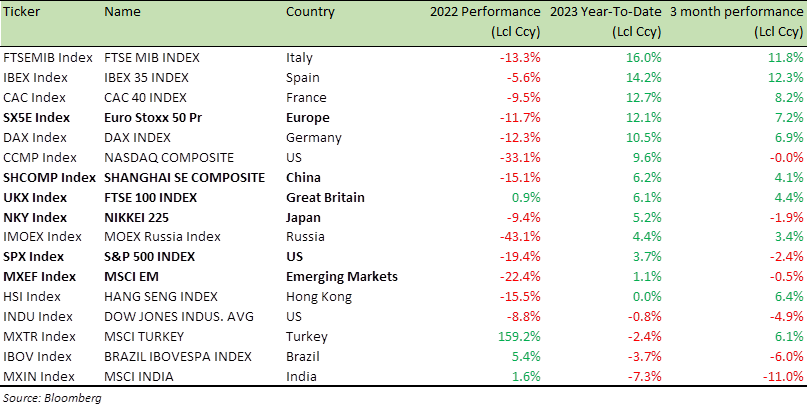
Source: Bloomberg
With short-term rates pricing in Fed Funds at well over +5%, earnings yields are only slightly above 6-month US Treasury bill yields.
With so much return available risk-free at the front of the curve, equities have work to do keeping valuations high enough amidst falling earnings estimates.
This is where Structured Products become a useful means of investing in equities. They offer a degree of capital protection, while at the same time helping pick good entry points in the market, and also offer means to clips coupons in a flat to negative market.
For specific stock recommendations and Structured Product ideas please do not hesitate to contact me or your relationship manager.
Best wishes,

Manish Singh, CFA