

“The US headline inflation at +6.5% doesn’t convey the full picture of where inflation is headed. Inflation is crashing. The new bull run may already be here”
Summary
The new Bull market is already here – Chinese equities, the EuroStoxx 50 and Emerging Market equities – have broken their downtrend and are up more than +20 to 30% from their recent lows. However, there is no Bull market for US equities yet.
The relaxation of China’s strict zero-Covid policy has boosted the economic growth prospects and the likely export prospects of the Eurozone. Add to this, the warmer weather in Europe, which has helped temper the intensity of the energy crisis feared over the last quarter, and Europe may actually avoid a recession by the looks of things and the US may experience one. How ironic would that be?
After negative returns in 2021, last year, US Treasuries, arguably, the safest asset in the world, returned -17%. Their worst returns since the State of Massachusetts ratified the United States Constitution and became the sixth US State in 1788. In their 250 years history, US Treasuries have never had three consecutive years of negative returns. So, it’s safe to conclude (and history is onside) that 2023 will be a positive year for investment in US Treasuries. The US is nearing the end of the interest rate cycle and rate cuts lie ahead.
Given how negative sentiment is towards economic growth and US equities, the biggest contrarian trade for 2023 would be: The US avoiding a recession as the Fed relents and does not raises rates to +5.25%. The S&P 500 in such a case could have a +20% year.
The US ISM index has continued to drop, the OECD leading indicators have dipped into contractionary territory, yield curves have inverted, recession talk is everywhere…and yet over the last three months, copper prices have risen +28%. Dr Copper seems to be telling us something. China’s re-opening is a big boost to the global economy and copper prices. This, in my view, is the key macro development that will have a profound effect on asset prices this year. So stay tuned!
Skate to where the puck is going to be…not where it has been
Equity markets have started the year on a positive note with European, Chinese and Emerging Market (EM) equities, continuing to build on their rally that began in Q3 last year.
The new Bull market is already here – Chinese equities (ASHR) are up over +30% from their lows, the EuroStoxx 50 (SX5E) is +26%, and the MSCI Emerging Market Index (EEM) is +24%, as they have all broken their downtrend.
However, there is no Bull market for US equities yet. The S&P 500 (SPX) and the NASDAQ (QQQ) are up +12% and +10% respectively from their October lows. The focus in the US still seems to be on inflation and interest rate hikes by the US Federal Reserve (Fed).
If the US does experience a recession, much of the blame will rest with the Fed, which has continued to raise rates, despite all signs that inflation is not only under control, but has collapsed.
Let’s look at the data for US inflation. The chart below lays out the month-on-month change in the US Consumer Price Index (CPI) index, a measure of US inflation.
A glance at the chart will tell you that the six-month prints from July 2022 to December 2022 couldn’t be more dissimilar from the prior six-month prints.
US Consumer Price Index (CPI) month-on-month change – 1 year chart
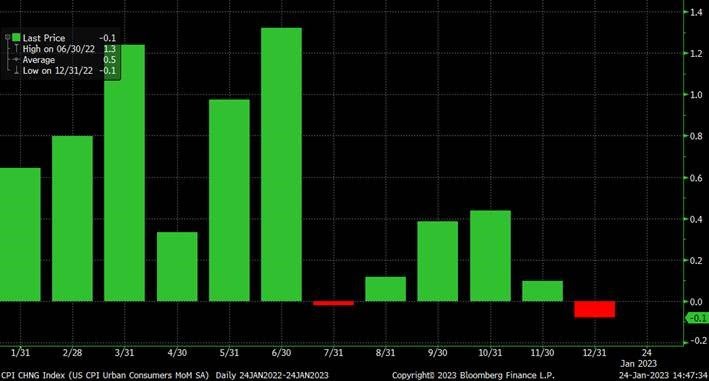
Source: Bloomberg
The US CPI hit a 40-year high in June last year, after months of sustained price increases. However, since then, the monthly gains have slowed down sharply.
US Inflation has declined over the past three to six months, due largely to falling energy prices and prices of goods, such as used cars. There are certain signs that soaring rents and other housing costs are cooling, amid a sharp slowdown in demand, although this isn’t expected to show up in official CPI measures, until later this year, such is the quirkiness of the CPI calculation.
A simple calculation will reveal:
- The US CPI annualised at +10.4% in the first half of 2022, and
- The US CPI annualised at +1.8% in the second half of 2022 which is close to the average annual inflation rate of +1.7% between 2010 and 2020
Taken together, it left the headline inflation at +6.5%, which still doesn’t convey the full picture of where inflation is heading.
One should be more concerned about where inflation is heading and not where it is. As the ice hockey great Wayne Gretzky once said: “A good hockey player plays where the puck is. A great hockey player plays where the puck is going to be.”
The “inflation puck” is already below the Fed’s target rate of inflation of +2%.
The Fed has continued to sound hawkish and kept the relentless focus on the headline number, as it seeks to overcompensate for past mistakes. This has led many to stay focused on rate hikes rather than see the impending pause, followed by rate cuts, as data deteriorate.
In my opinion, there is no need for the Fed to raise rates any further. However, I don’t run the Fed and therefore, I reiterate what I wrote in the December Market Viewpoints – “The Fed will be forced into cutting interest rates in Q3 as it responds to recession.”
The more the Fed raises rates from here, the more it begets a recession and rate cuts down the line. The market knows this and as such, you have seen a steady rally in risk across asset classes.
When looking at annual change (chart below), 2022 marked the most aggressive (largest) move for the Fed Funds Rate in the last 50 years.
The US Federal Funds Target Rate (upper bound) – Annual change
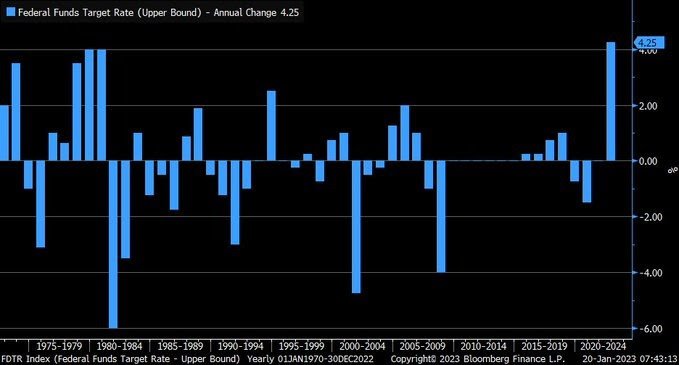
Source: Bloomberg
Financial conditions are very tight and the economic data isn’t getting any better.
Earlier this week, the crucial Conference Board’s Index of Leading Indicators reading (chart below) dropped -1.0% versus already weak expectations of a decline of -0.7%.
Not only that, but November’s reading was also revised down from -1.0% to a drop of -1.1%
- On a Year-on-Year (YoY) basis, the index of Leading Indicators is now down -7.4%, the weakest YoY reading since the Covid-19 lockdowns and the level we saw during the 2008-09 recession induced by the Great Financial Crisis (GFC)
- The chart below shows the YoY change in Leading Indicators since 1963 with the red line indicating the level as of December 2022. Since 1960, there has never been a time when the YoY reading was as low or lower than it is now and the economy wasn’t in a recession
- There were also two other periods where the economy had a recession, and the YoY change wasn’t even as negative as it is now
December’s decline in the index of Leading Indicators was the third straight month of over -1% drops. In every prior period since 1963, where there were at least two consecutive month-on-month declines of at least -1%, the economy was already in a recession.

Source: Bespoke Invest
Are we already in a recession?
Well, the data is weak across the board. However, in the current President Joe Biden economy, two conservative quarters of negative GDP isn’t considered a recession. Additionally, the employment leg is still holding strong and consumers are still spending the savings they accumulated during the recent lockdown.
That being said, I have no doubt that the Fed must be getting worried about the recessionary indicators turning a brighter shade of red.
The Fed will very likely increase rates by +0.25% next week. That increase would bring the Fed Funds Rate to a range between +4.5% and +4.75%.
Most Fed officials projected in December that rates would rise to a peak between +5% and +5.25%. That would imply two more +0.25% increases, after the likely increase next week.
A Fed Funds Rate at +5.25% is not my base case and rates at that level will make a US recession even likelier. However, I do see a scenario in which Fed does take rates to +5.25%.
The Fed has rightly turned its focus recently toward a narrower subset of labour-intensive services, by excluding prices for food, energy, shelter and goods.
Inflation in this narrow category is running at +4.4%, up from around +2.3% on average between 2010-19. This data will reveal, if higher wage costs are passing through to consumer prices.
If services inflation is high, because pay checks are rising in lockstep with prices, then Fed officials would want to see more hiring slowdown to avoid a 1970s-style wage spiral setting in i.e. rates will have to go higher, possibly to +5.25%, unemployment will rise and wages will moderate. The US jobs market has been tight, with an unemployment rate of +3.5% in December matching multidecade lows.
In such a scenario, a US recession is even more likely than it already is, given a lot of growth data is already flashing red.
I maintain that rates will have to be cut in the second half of this year by as much as 150 bps (if not more), as a recession ensues.
Markets and the Economy
Fashionistas will tell you that Europe sets the trends. This certainly seems to be the case as far as equity markets are concerned, with the Eurostoxx 50 (SX5E) outpacing the S&P 500 (SPX) by a wide margin (see table below). It goes to show what “unloved/oversold” assets can do when they change course.
Benchmark Global Equity Index Performance (2022, 2023 YTD and 3 months)

The relaxation of China’s strict zero-Covid policy has boosted growth prospects and likely export prospects of the Eurozone. Add to this, the warmer weather in Europe, which has helped temper the intensity of the energy crisis feared over the last quarter.
On economic activity front, on Tuesday, S&P Global said its composite output index for the US, a closely watched survey of business activity, was 46.6 in January, a slightly better reading than December’s reading of 45. In Europe, however, the index rose to 50.2 from 49.3. A reading above 50 points to an expansion, while a reading below that level points to a contraction.
Europe may avoid a recession by the looks of things and the US may experience one. How ironic would that be?
One clear explanation for all this – the difference between Eurozone and US monetary policy
In the Eurozone, interest rates didn’t start increasing until July, and we have seen a total increase of +2.5% (see chart below).
In the US, rates started increasing in March, and we saw an increase of +4.5%. The US got to +2.5% rate when the Eurozone was still at 0% in July. If there’s one consolation – rates in Europe have further to rise, perhaps another +0.75% to +1%, while the US may be nearing the end of its rate-increase cycle.
12-month chart – ECB main refinancing rate and US Fed Funds Rate
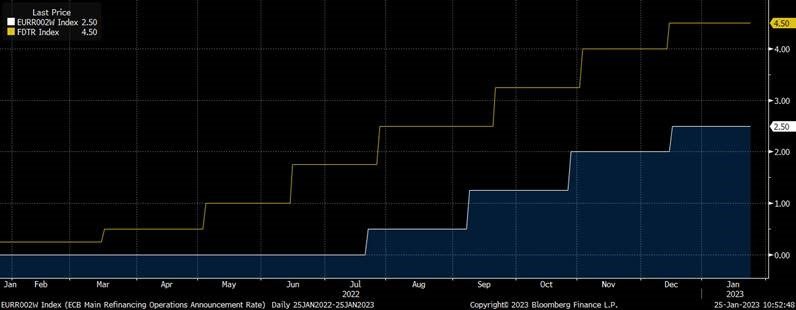
Source: Bloomberg
As the trade-weighted US dollar (DXY) has pulled back -9.5% from its high in September, Emerging Market currencies versus the US Dollar have risen over +10%, on a total return basis. As a result, over the last three months, Emerging Markets equities (EEM) have outperformed US equities (SPX) by over +20%.
Also, if rates were to go higher in the US, then other markets will have consternation too i.e., no rapid rise in equities to a higher level.
As I wrote in my December Newsletter, I see a +10% year for US equities, and we have seen half of this already.
Technically, a lot is going on for the SPX (see chart below).
A clear break above the 200-day moving average (DMA) will be very positive for the SPX. Also, what we have seen recently are higher lows (filled circles in the chart below), a sign that momentum is building up.
I do not see new lows (barring an inflation spike, and a re-aggressive Fed). A rip-roaring rally can be ruled out as long as recession fears overhang. Not until the Fed indicates it is willing to cut rates, will you see a stable up-trend.
Until then clipping coupons and investing in income strategies on a basket of oversold/attractively priced equities or broad market equity indices are sensible trades to do.
1-year price chart: S&P 500 Index
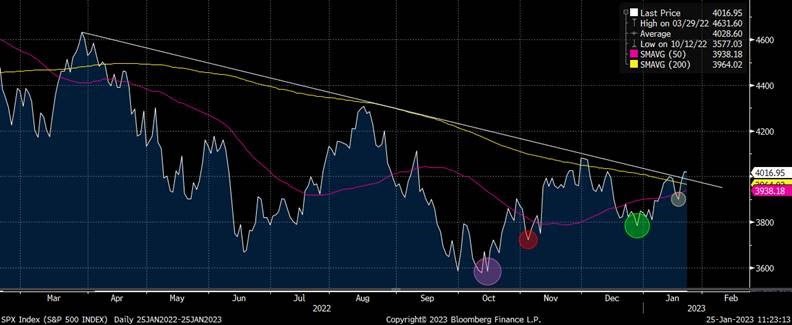
Source: Bloomberg
US Treasuries’ (10 Year US Govt bond), arguably the safest asset in the world, returned -17% in 2022. This is its worse return since 1788. Yes, you read that correctly, the worse return since Massachusetts ratified the United States Constitution and became the sixth US State in 1788.
2022 was also the second year in a row of negative returns for US Treasuries. In their 250 years history, US Treasuries have never had three consecutive years of negative returns.
So, it’s safe to conclude (and history is onside) that 2023 will be a positive year for investment in US Treasuries. The US is nearing the end of the rate cycle and rate cuts lie ahead.
By the same reasoning investment in investment grade bonds – 2 to 5-year duration – seem to be a sensible trade. The Investment grade yield curve, at the shorter end, is more elevated and offers investors an attractive yield of +4% to +5%. Besides, any future rate cuts will impact shorter end 2y bonds more than the 10y bonds.
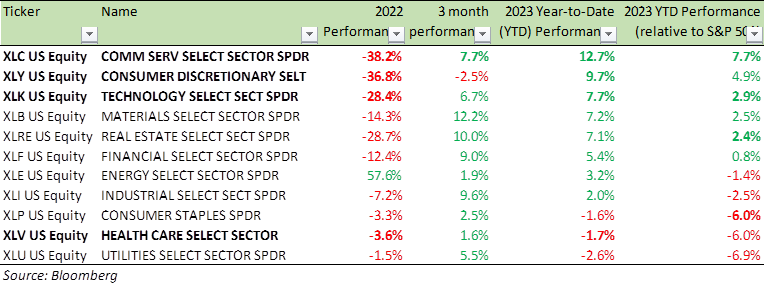
Benchmark US equity sector performance (2022, 3 month, 2023 YTD and 2023 YTD relative to the S&P 500 index)
Former UK Prime Minister Margaret Thatcher once said – “Nothing is more obstinate than a fashionable consensus.”
Given how negative sentiments are towards economic growth and US equities, the biggest contrarian trade for 2023 would be: The US avoiding a recession as the Fed relenting and not raising rates to +5.25%. The S&P 500 in such a case could have a +20% year.
Let me give you something to chew on as you, if only briefly, dwell on this constructive/bullish view.
Copper is often described as “the metal with a PhD in economics” as it forecasts economic expansion and contraction. The chart below plots the price of copper alongside the US ISM Manufacturing PMI index, one of the most reliable monthly indicators of US economic activity.
The ISM index has continued to drop, the OECD leading indicators have dipped into contractionary territory, yield curves have inverted, recession talk is everywhere … and yet over the last three months, copper prices have risen +28%.
Dr Copper seems to be telling us something. China’s re-opening, as it abandoned its misguided zero-Covid policy, is a big boost to the global economy and copper prices. It is the key macro development that will have a profound effect on asset prices this year.
Chinese mortgage rates are at record lows, household cash piles are at record highs, and the Chinese government has scrapped its “three red lines” which restricted bank lending to the real estate sector. The resulting demand boost by itself, could explain the sudden rebound in copper prices and hence economic activities.
So, I would caution against too much pessimism.
Price chart: Copper and ISM Manufacturing PMI index (NAPMPI)
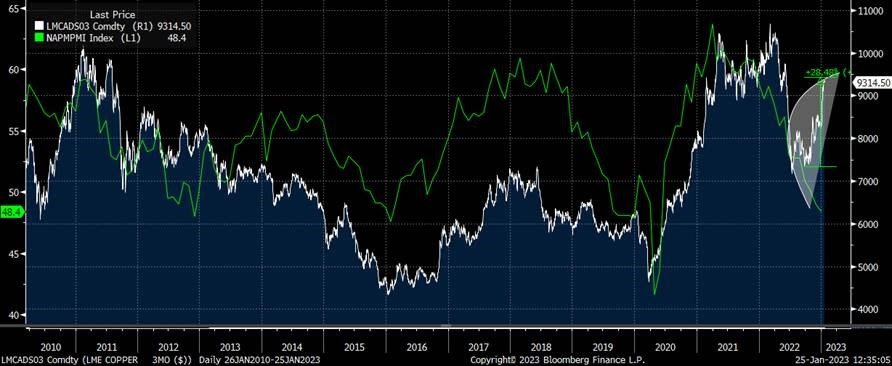
Source: Bloomberg
And here’s some data to mull over as you make up your mind:
- The S&P 500 has historically posted stronger gains in February and for the remainder of the year when January has been an up month
- Including 2023, there have been 13 years since WW2 where the SPX gained in January after posting declines in the prior year. Those years have seen a strong rest-of-year return with an average gain of +16% from the end of January through December and positive returns 10 out of 12 times.
- In the eight prior years since WW2 where the SPX gained at least +4% in January, after posting a decline in the prior year, the index rallied at least +10% for the remainder of the year all eight times with an average gain of +21%
The SPX is currently up +4.6% month-to-date after falling -19.4% in 2022. With four trading days to go this month, let us hope this gain is maintained.
For specific stock recommendations and Structured Product ideas please do not hesitate to contact me or your relationship manager.
Best wishes,

Manish Singh, CFA