


The Fed Funds rate is expected to get to +5%. The US economy will likely enter a recession by mid-2023 and the Fed will be forced into cutting interest rates in Q3.
Summary
Europe is not out of its energy crisis and a long spell of severe cold weather could make it worse in Q1 of 2023 as well as the winter of 2023, when storage would run low. It will take more than warm words from the politicians in charge to avert a major recession next year on the Continent.
Over in the US, the recent bout of high inflation, precipitated by two key factors – excessive money supply growth, and self-inflicted supply-side restrictions driven by lockdowns, are now in the rear-view mirror. Inflation is falling and money-supply growth is now flatlining. However, with the US Federal Reserve (Fed) still insistent on raising rates from current levels, the fate of a US recession in 2023 is sealed. The US economy will likely enter a recession by mid-2023 and the length and depth of this recession will depend on how quickly the Fed responds.
The Fed will be forced into cutting interest rates in Q3 as it responds to the recession. The Fed Funds rate -currently at +4% and expected to get to +5% – will end 2023 in the +2.75% to +3% range i.e. a 200bps rate cut over Q3-Q4 2023 levels.
A recession doesn’t have to be doom for equities and markets tend to bottom before recessions start. Market sentiment towards equities continues to be bearish. If you turn bullish when everyone else is bullish, then you are buying late in the cycle. There is an opportunity cost to it which accumulates over time. Instead, I recommend you focus on equity market internals and invest in tranches over time. In my opinion, we saw the bottom on the S&P 500 at the 3600 level in June 2022 when inflation peaked at +9.1%. My end-of-2023 target for the S&P 500 is 4,290 i.e., +10% up from current levels.
The record US Dollar rally that we have seen this year ran out of steam in October. The US Dollar will continue to weaken, as concerns about the US economy grow and inflation fears recede further in Q1 and Q2 of next year.US dollar weakness will certainly help earnings for companies that generate a large portion of their revenues outside of the US.
“Baby It’s Cold Inside”
Temperatures are plummeting across Europe and it is -3 degrees today in London, as I write this note.
The arrival of a wintery storm “Troll of Trondheim” is expected to bring snowfall to the UK over the weekend. It is getting colder by the day. Meanwhile, energy prices remain extremely high.
Thankfully, it is also the time of the year when Christmas/wintery songs take over the airwaves, so there is some cheer in the air. It’s safe to say, that if you are not living in a cave, you’ll likely hear Baby, It’s Cold Outside a few times over the rest of December.
The song won the Academy Award for best song in 1950 where it featured in the film “Neptune’s Daughter” starring Ricardo Montalban and Esther Williams. In one scene, as Esther tries to stand up, Ricardo pulls her back down by tugging her arm, points to the cold weather outside and serenades her with – baby it’s cold outside – to persuade her to stay.
High energy costs and the drive to reduce energy bills this winter in Europe, may see this now Christmas classic – baby it’s cold outside – turned on its head as Esther responds to a lovestruck Ricardo’s overtures with – baby it’s cold inside. And who would blame Ricardo if he didn’t have proper heating on?
Gas prices in Europe are still five times as great as what is considered to be normal levels.

Europe is not out of its energy crisis and a long spell of severe wintry weather could make the energy crisis worse in Q1 of 2023 as well as for the winter of 2023, when storage would run low. It will take more than warm words from the politicians in charge to avert a major recession next year on the Continent.
In the UK, the government has approved the first new coal mine for 30 years in Cumbria. I hope other governments across Europe follow the lead and deal with the energy crisis which could devastate industry, life, and livelihoods. Those focusing on 2050 and “net zero” would agree that we need to make it through 2023 first.
If there is one thing that has concerned the markets more than anything this year, it is inflation.
As we head into 2023, the big question is – What is the outlook for US inflation (CPI) and the outlook for the US Fed fund Target Rate (FDTR)?
Here is what I believe happens in 2023:
- US inflation slides more rapidly than anticipated with US CPI getting to +4% by the end of Q1
- The US economy enters into a recession by mid-2023
- The US Federal Reserve (Fed) is forced into cutting rates in Q3 as it responds to the recession. The Fed Fund rate (currently at +4% and expected to get to +5%) will end 2023 in the +2.75% to +3% range i.e., a 200bps rate cut over Q3-Q4 2023 levels
Allow me to explain.
Regular readers of this newsletter will know that I believe inflation is not a problem in the medium term and that we will be back to the disinflationary period of pre-Covid years.
In the April 2021 Market Viewpoints I wrote “the last 250 years of US inflation can be summarised as – a very long period of little or no inflation, a couple of decades of high inflation in the 1970s-80 and back to more than three decades of low inflation. My gut tells me that we will see a short burst of high inflation but over the medium-term, inflation is not a significant risk.”
We have seen a bout of high inflation in terms of levels the CPI reached. I would say any Year-over-Year (YoY) CPI print of +7% and over, can be classified as “high inflation.”
- US CPI reached +7% in December and is still above that level. However, the good news is that the data suggests US CPI peaked in June this year at +9.1% and has been coming down steadily since
- The November US CPI report is due next week. The current estimate for November’s Month-on-Month (MoM) CPI is +0.3%
- If CPI comes in at that +0.3% MoM for November, it will take the YoY CPI reading down to near +7% (last print +7.7%)
- However, a decline in the MoM CPI for November, let us say -0.1% (not impossible given the sluggishness of recent macro data) will get us to +6%
We had big MoM US CPI prints in February (+0.8%) and March (+1.2%) of this year. As they drop off the annual CPI calculation and are replaced by new prints for February 2023 and March 2023, the CPI will move down quickly. I expect the CPI number down into the +4% range by next spring.
If that happens, we definitely won’t need a Fed Funds Rate at +5% for long i.e., the short burst of high inflation is over, and we are in for moderate levels going ahead.
This recent bout of high inflation was precipitated by two key factors – excessive Money supply (M2) growth, and self-inflicted supply-side restrictions driven by lockdowns. Both factors are now in the rear-view mirror. M2 is the measure for the currency in circulation that includes M1 (physical cash and checkable deposits) as well as “less liquid money”, such as savings in bank accounts. M2 growth which got to as high as +26.8% in Feb 2021 is now flatlining (more on this further down, and in the chart below).
The Western world has been out of lockdowns since February and even China has now cast off its “zero-Covid” policy. The local authorities across China are paring back some of their strictest Covid-19 control measures, even as the number of new infections remains elevated. This is good news for the supply side (as well as bringing Chinese consumption demand back online)
The chart below plots the year-on-year (YoY) growth rate of US inflation (CPI) and the growth rate of M2 supply.
As you would guess, CPI follows the increase in M2, with a lag as prices generally respond to the increase in money supply working its way through the economy impacting demand.

The M2 supply kicked into high gear around January 2020 and continued to increase as various stimulus efforts to deal with Covid-19 were implemented. The M2 growth eventually peaked a year later in February 2021 at +26.9%. At the time, the inflation was at +1.68%. Since then, the M2 growth has been coming down and inflation has been rising.
Any challenges (foreseen or unforeseen) on the supply side just make the CPI worse. This is what we saw with Covid-19. It was not just the M2 increase but the restrictions on supply that had a bearing on the CPI too.
The red circle in the chart above highlights “the inversion” – the rate of change of M2 and the rate of change of CPI crossing each other i.e., prices rising faster than money supply. This inversion is often a predictor of a recession ahead and in my opinion, we have crossed the Rubicon. With the Fed still insistent on raising rates, and as per the Fed’s projection of at least a +100bps rise ahead, the fate of a US recession in 2023 is sealed. The length and depth of the recession will depend on how quickly the Fed responds.
Here is how an increase in Money supply (M2), followed by an increase in CPI and an increase in interest rates bear on the economy to cause a recession that begets rate cuts:
- When the M2 increases, but prices remain largely the same there’s initially an increase in the real demand for goods and services. However, the increase in M2 is only demand stimulatory until the prices of items eventually rise and reduce demand
- Once prices rise sufficiently, the level of real demand, all else being equal, and in absence of any productivity gains, reverts to its pre-stimulatory level. As demand contracts, businesses scale back their output. Central banks and businesses realise – the money supply did not create any new wealth (How could it – it was not invested in a productive capacity as is often the case with stimulus checks)
- A recession follows and interest rates are cut
Even as the S&P 500 (SPX) has moved down and sideways, the percentage of stocks above their 200-DMAs continues to grow and show positive breadth divergence. It is a sign of market internals getting stronger despite the prevailing bearish narrative.
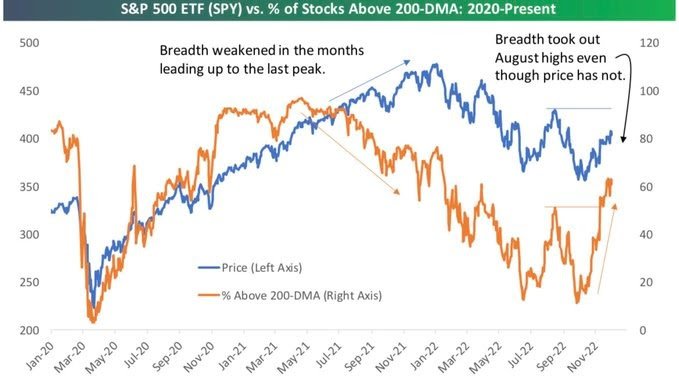
Source: Bespoke Invest
A focus on the medium term will spare you the anxiety of short-term volatility. In this sell-off, the SPX bottomed at 3600 in June and here we are end of the year, with the SPX at 4,000.
Income strategies earned (accumulated) a carry of +8% if you stayed invested or invested when everyone was bearish mid-year. We saw the same in the depths of Covid-19 driven market sell-off in Q1 2020. Central banks can change the narrative without any warning. It can lead to a shallower recession (or a recession avoided)
If you turn bullish when everyone else is bullish, then you are buying late in the cycle. There is an opportunity cost to it which accumulates over time. Instead, In recommend you focus on market internals and invest in tranches over time. My end-of-2023 target for the SPX is 4,290.
Recession does not have to be doom for equities and markets tend to bottom before a recession starts. In my opinion, we have seen the bottom on the SPX at the 3600 level in June 2022, when inflation peaked at +9.1%.
Markets and the Economy
Given the year we have had, it was a solid November and Q4 year-to-date for the equity markets (see table below).
Benchmark Global Equity Index Performance (2021, 2022 YTD and QTD)
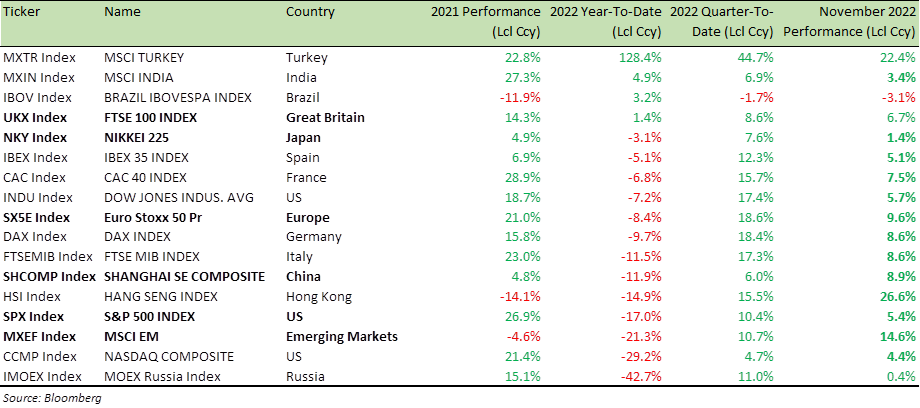
The US mid-term election year “seasonality” that I first mentioned in the August’s Market Viewpoints kicked in, in a very timely manner, and delivered solid double-digit returns over the months of October and November. Let us hope it lasts the next couple of weeks into year-end and we finish the year in a flourish with a “Santa rally” to close the year.
On a Year-to-Date (YTD) basis, we are still down -15% to -20% across the major indices and, more so, if you measure the returns in US Dollars.
The record US Dollar (USD) rally that we have seen this year, has now run out of steam, as US interest rate expectation have moderated. The recent decline in bond yields has been accompanied by a big drop in the USD as well. This is a complete reversal of the sticky trend of – higher rates, higher US dollar and lower stock prices – that we saw in Q3.
While the SPX moved back above its 200-Day Moving Average (DMA) this week after 162 trading days below it, the US Dollar Index (DXY) finally broke below its 200-DMA last week for the first time in more than 350 trading days (chart below). The streak of closes above the 200-DMA for the US dollar was easily its longest on record dating back to the 1970s. The next-longest streak ended at 231 days in March of 2019. You may recall that a “Fed pivot” followed by rate cuts started within six months of that. As I have mentioned above, I expect the Fed to start cutting rates in Q3 2023.
US inflation peaked in June and the US Dollar peaked in October when the US Dollar Index (DXY) hit a peak of 114. Since then, the DXY has been trundling down and currently sits at 105. At 105, the DXY is still 10-point higher than at the beginning of the year. I expect the USD to continue weakening, as concerns about the US economy grow and inflation fears recede further in Q1 and Q2 next year. USD weakness will certainly help earnings for companies that generate a substantial portion of their revenues outside of the US. The market has factored this in as well. Since the US dollar’s peak, stocks that generate 50%+ of their revenues outside the US have averaged a gain of +18.3%. Stocks that generate all their revenues domestically are up just +11.8% over the same period.
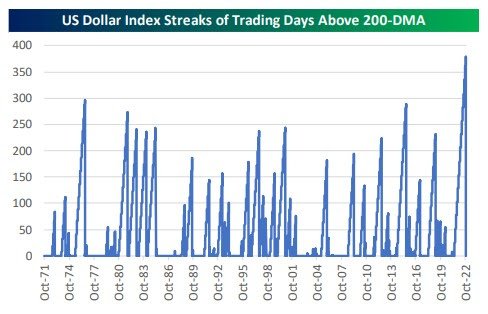
Source: Bespoke Invest
Market sentiment towards equities continues to be bearish. The average upside target for SPX for 2023 is +2.2% (range -5.3% to +14.4%, median +3%) as per the forecasts of the nine Global investment Banks (Goldman Sachs, JP Morgan, UBS, Citi, Morgan Stanley, Deutsche, Barclays, Bank of America, and Credit Suisse).
The American Association of Individual Investors’ (AAII)’s weekly investor sentiment survey, shows the percentage of investors who are market bullish, bearish, or neutral on stocks. The most recent survey had more bears than bulls for a record 35 weeks in a row (see chart below). It is the longest streak since 1987. It is safe to say the consensus is bearish.
“Nothing is more obstinate than a fashionable consensus” as former UK Prime Minister Margaret Thatcher once said. Consensus does not happen by magic; it must be driven and forged. Beware of a consensus driven by 24×7 doom-mongering and flashing headlines on television. Focus instead on the medium term and let’s learn from history. Being bearish and seeking the “safety of consensus” can be fashionable, but it could also lead to lost opportunities.
As the analysts at Goldman Sachs’ GIR recently put it: “in the 20th century alone, we dealt with two great wars (one of which we initially appeared to be losing); a dozen or so panics and recessions; virulent inflation that led to a 21.5% prime rate in 1980; and the Great Depression of the 1930s, when unemployment ranged between 15% and 25% for many years. America has had no shortage of challenges. without fail, however, we’ve overcome them. in the face of those obstacles — and many others — the real standard of living for Americans improved nearly seven-fold during the 1900s, while the Dow Jones Industrials rose from 66 to 11,497.”
We live in a world which is constantly evolving. Emerging market growth lies ahead of us. We have left the pandemic behind and, while the economic damage from it will take time to heal, lessons have been learnt. The damaging lockdowns of 2020-21 are unlikely to be repeated.
I have no doubt fossil fuel will be back in demand more than anyone prices in.
There is more data, and that data needs more security. Tech, SaaS, cyber-security, big-data, semi-conductor stocks etc., are not a fashionable investment, but a necessity for the long term.
Barring a nuclear war, we are not reversing the trend set over the last two decades of innovation and change. A single Google search today requires more computing power than it took to send Neil Armstrong and eleven other US astronauts to the moon.
It means that now is the time to keep building up your long equity positions before more investors turn from bearish to neutral and eventually to bullish.
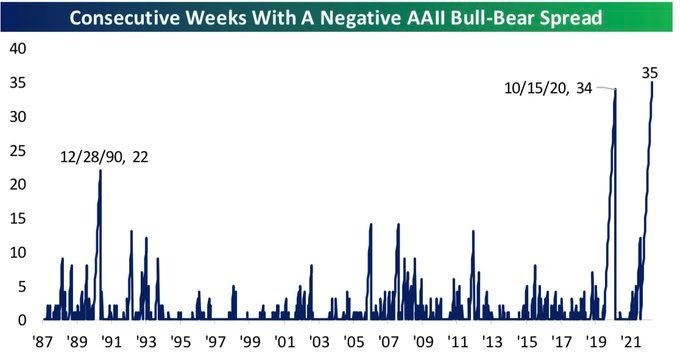
Source: Bespoke Invest
A few quick comments on the bond market.
In what has been accurately described as the – worst year in history for US Treasuries – we have now seen a nice bounce over the last six weeks. The 20+ Year Treasury ETF (TLT) is now up over +18% since mid-October and is in the process of breaking above the top of its 2022 downtrend. TLT has only seen a month-over-month rally of over +15% during three other periods since its inception in 2002. Prior sharp one-month moves higher for TLT have come during periods of significant weakness for stocks that ultimately marked attractive entry points.
20+ Year Treasury ETF (TLT): 12-month price chart
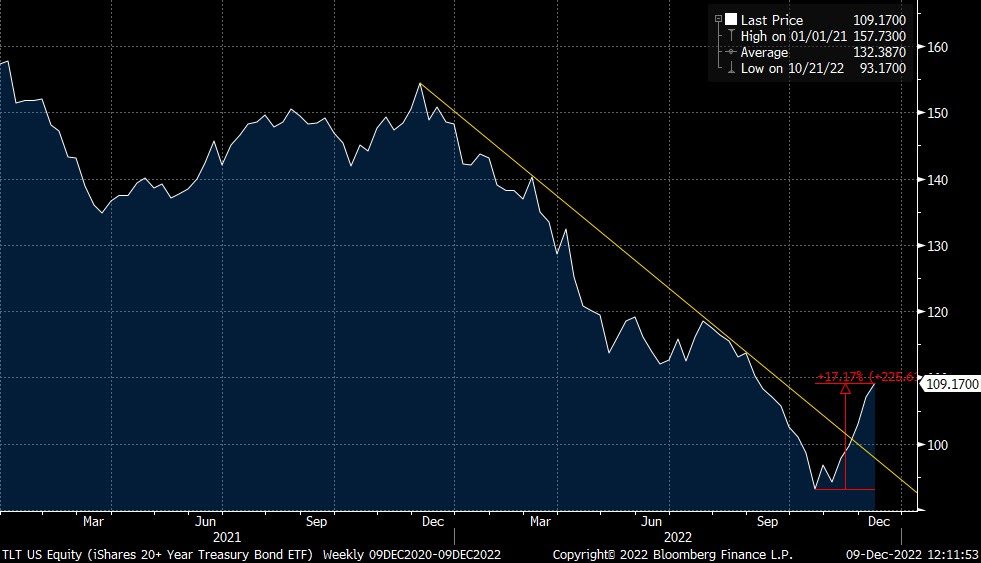
Source: Bloomberg
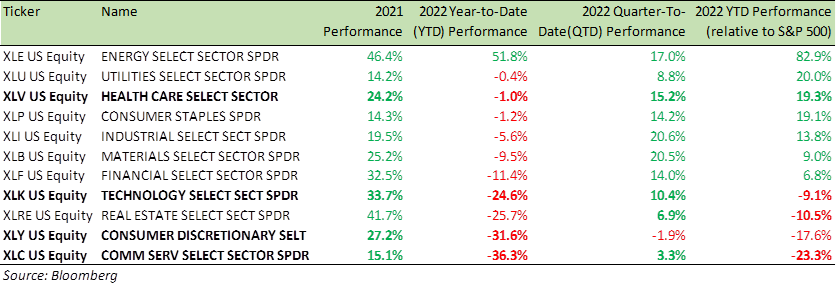
In terms of equity sector performances
- The Energy sector (XLE) remains up +53% YTD see table below), with less than a month to go in 2022
- The only other sector ETF that is close to turning green is Consumer Staples (XLP). It was green at the start of the week and then slipped
- Four sectors are underperforming the broad SPX) – Communication Services (-23%), Consumer Discretionary (-18%), Real Estate (-11%), and Technology (-9%).
Looking at sector breadth, even though Energy is up the most YTD, it currently has the lowest % of stocks above their 50-DMAs (73.9%). Five sectors have more than 90% of stocks above their 50-DMAs: Industrials, Consumer Staples, Materials, Technology, and Utilities. These sectors are showing signs of momentum building up.
Industrials has probably been the most stand-out sector recently. It has rallied the most QTD and it has the most stocks above their 50-DMAs and the second most stocks above their longer-term 200-DMAs.
Benchmark US equity sector performance (2021, 2022 YTD and QTD, 2022 YTD relative to the S&P 500 index)
With sector indices still recovering, it is time to keep building your long positions.
- Tailwinds for equities: Strong seasonality, over bearish investors, less hawkish Fed, moderating inflation
- Headwinds for equities: Recession risk ahead, good short-term rally so far i.e., consolidation of levels, SPX still not above 200 DMA
As I have been saying since June at least, there are plenty of high-quality stocks in the Consumer, Technology, Industrial and Healthcare sectors that are trading at -20% to -25% on a YTD basis, and present a good buying opportunity, be it directly or via Structured Products.
Structured Products in investment portfolios offer an investor the opportunity to benefit from prevailing market volatility. If you can take a 3–5-year investment view, the stocks and/or indices underlying the products do not necessarily have to rally for one to earn 10-12% in income from the products annually.
For instance, last week, we launched a 5-Year product on a basket of (Disney, Pepsi, Nike, and Constellation Brands) where the coupon was +15.6% per annum, the protection barrier was set at 60% at maturity and the losses do not accrue from 100% but from the 60% level, if the barrier is reached at maturity. In summary, therefore, Structured Products offer: Equity exposure, solid income, and good downside protection.
For specific stock recommendations and Structured Product ideas please do not hesitate to contact me or your relationship manager.
Anyway, all that is left for me to say this year, is to thank you for your time and attention.
I also wish you and your families all the best for the holiday season as well as a very Happy New Year. And if you celebrate Christmas – I hope you have a great one and stay warm.
Best wishes,

Manish Singh, CFA