

“Buy when everyone else is selling and hold when everyone else is buying. This is not merely a catchy slogan. It is the very essence of successful investments.”
-Jean Paul Getty
Summary
Despite a record contraction in US GDP during the second quarter of 2020, the S&P 500 Index hit a new all-time high. So why this rally when the economy is in a downturn? Well, the stock market is not the economy. The US stock market is less service driven than the US economy and Covid-19 hit the services economy much harder than it hit manufacturing The US stock market is also more global, while the US economy, as you would suspect, is more local. Demand for US made goods, particularly technology, has continued to be strong despite the pandemic. The US stock market is also more investment driven while US economy is more consumption driven. Capital investment which increasingly is supported by higher and higher technology spend, has been hit far less than the hit to consumer spending. Finally, equity returns are driven by surprises relative to the expectations. Whether positive or negative, surprises have a big impact on equity returns. Covid-19 turned sentiment very negative. However, unprecedented government stimulus combined with optimism among investors about the world’s ability to manage the pandemic have been the positive surprises, that have lifted equity markets.
Now that the SPX has erased all its losses from the Covid-19 meltdown, where do we go from here?
In my view, the risk is still to the upside, albeit, technology stocks look overvalued and could be in for a short term reversal. As equity sector returns indicate, besides the technology and the communications sectors (and a few consumer discretionary stocks such as Amazon), most sectors are still barely positive for the year. Most importantly, fiscal stimulus is still in place and more is to follow as the CARES II deal takes shape in the US. The Federal Reserve still seems concerned with the plethora of unknowns that could stall, or in the worst case, exacerbate the downward pressure on growth. It will be a very long time before interest rate increases are discussed, let alone actually raised. At the last Federal Open Market Committee (FOMC) meeting, most officials didn’t expect to raise interest rates at least through 2022.
The Stock Market is not the Economy
US GDP contracted by $1.8 trillion (an annualised rate of -32.9%) during the second quarter of 2020. The collapse was unprecedented in its speed and severity. Yet, we saw the S&P 500 Index (SPX) hit a new high. The SPX has now rallied by more than +50% from its March lows (see chart below).
Although meant as a tongue-in-cheek remark, it’s often said that “a bubble is a bull market in which you don’t have a position.” There’s something frustrating in seeing someone other than yourself make all the gains as you sit on the side lines. So, you do the only thing that comes to mind – call the whole thing a bubble, wait for a correction and pray. Of course, in doing so, you risk doubling your pain, as the rally continues and, after a point, you finally decide to throw in the towel and join in. We saw something of the sort last week.
S&P 500 (SPX) Index – 12 month price chart
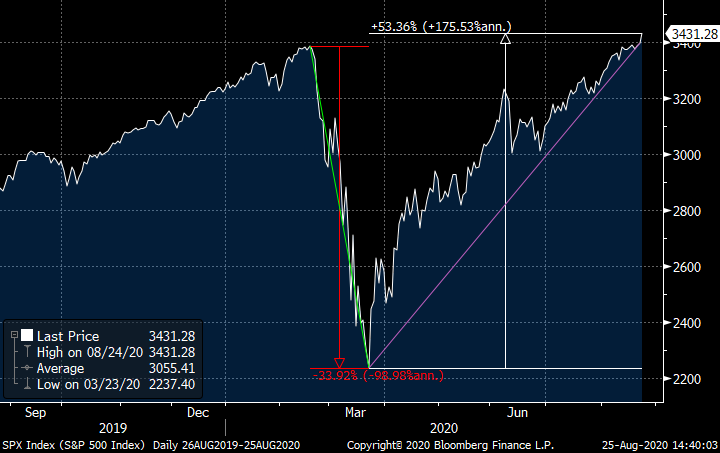
Source: Bloomberg
In the August month BAML Global Fund Manager Survey (FMS) – a monthly report that canvasses the views of approximately 200 institutional, mutual and hedge fund managers around the world – investors finally agreed that we were no longer in a “bear market rally.”
The survey, released on the same day the SPX hit record highs, found that investors were now most bullish on equities, since the start of the Covid-19 induced market sell-off that started in late February.
The August survey also noted that 79% of the survey respondents said they believed global growth over the next 12 months would be positive, representing the highest reading since December 2009. This is a dramatic turnaround from the June month FMS survey, where 78% of the participants said the stock market was “overvalued.” The SPX is up +10% since then.
So why this rally when the economy is still in a downturn? Well, the stock market is not the economy.
Below is an interesting chart from Eddy Elfenbein editor of the Crossing Wall Street blog. On the x-axis is the annual change in US GDP from 1970-2019 and on the y-axis is the corresponding stock market return. As you may note, the results look like a random scatter diagram, without any correlation. How can this be?
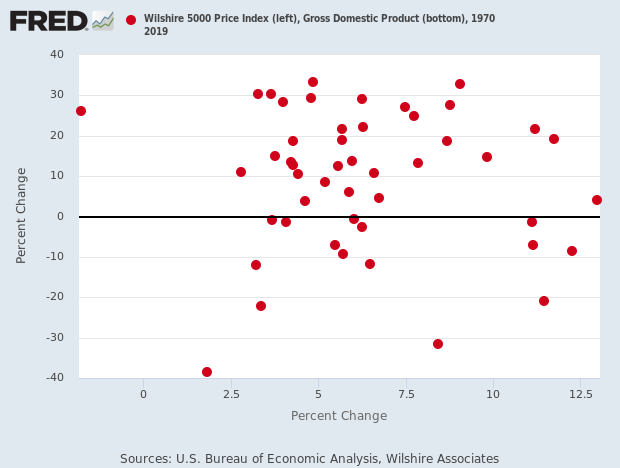
- The SPX is less service driven than the US economy. Goods-producing firms make up 44% of the SPX whereas manufactured goods comprise just 29% of US GDP. Covid-19 hit the services economy much harder than it hit manufacturing. Many of the services are still in the doldrums, whereas manufacturing has shown a healthy recovery.
- The SPX is more global, while US GDP, as you would suspect, is more local. Approximately 43% of the sales of the SPX are derived internationally, while US exports in the GDP calculation make up only 12%.
- The SPX is more investment driven while GDP is more consumption driven. Capital investment which increasingly is supported by higher and higher technology spend, has been hit far less than the hit to consumer spending due to widespread lockdown of avenues to spend – airlines, restaurants, retail, etc. As a result, the SPX has been more resilient to the pandemic.
- Equity returns are driven by surprises relative to the expectations. Whether positive or negative, surprises have a big impact on equity returns. Covid-19 turned sentiment very negative. However, unprecedented government stimulus combined with optimism among investors about the world’s ability to manage the pandemic have been the positive surprises that have lifted the equity markets. Writing the March month market viewpoints on March 23, 2020 where I made a case for – the market having bottomed. I wrote– “The bear case for equities …are also the very arguments for how the bull case for stocks starts. Fear is indeed palpable but it’s also the reason to start buying.” Looking back now, it all looks so prophetic.
Most things in economics and markets are relative and not absolute. When sentiment gets too bearish (as it did in March), I always countenance – do not ignore the reaction function. Those that turned bearish even when the SPX was at 2,300, were not taking into account the fiscal reaction that was to follow during an election year. The Trump administration was quick to compare the pandemic to a war, so it seems fitting it oversaw levels of stimulus and borrowing last seen in World War II, and the bears were caught on the wrong side of the trade.
Markets and the Economy
The Dow Jones Industrial Average (DJIA) is getting a makeover.
Salesforce (CRM), Amgen (AMGN) and Honeywell International (HON) will join the DJIA replacing Exxon Mobil (XOM), Pfizer (PFE), and Raytheon (RTN) respectively. Exxon, which joined the index in 1928 as Standard Oil of New Jersey, has been the longest-tenured member of the DJIA. While Amgen and Honeywell are like-for-like replacements, Salesforce, a technology company replacing Exxon, an oil major, after Exxon’s 92 years in the DJIA, is a sign of the times.
Tech companies are not just tech companies just as Amazon is anything but a “bookseller.” Tech companies are the retailers (Apple, Amazon), transporters (Uber, Lyft), healthcare providers (Taladoc, Livingo), bankers (Square, Paypal, Ant) and so many other things. They are present everywhere and in every sector of the economy.
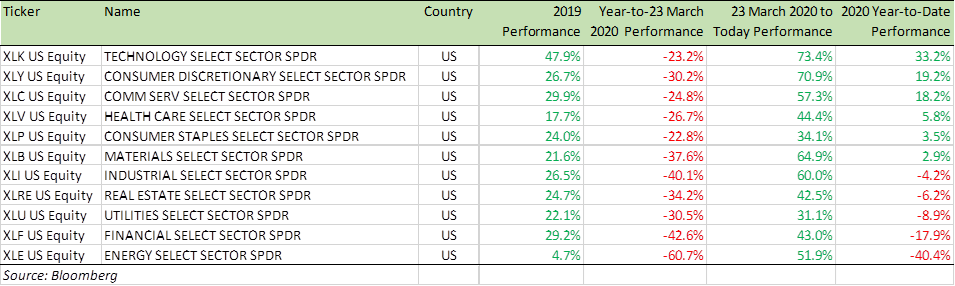
Just to underscore this point and the importance of tech and big data stocks, 2020 has been a case of the have and have nots (see equity sector chart below). There was a time, not long ago, when Energy (XLE) and Financials (XLF) were considered the life-blood of a capital intensive economy. However, these two sectors have been deemed irrelevant by the market in the current work-from-home world, where interest rates are close to zero and money is practically free. Instead, Communications, Technology, and Consumer/Retailer stocks with a strong online infrastructure, are the ever-important sectors of the economy.
Benchmark US equity sector performance (2019 & YTD)
Separately, the Covid-19 situation in the US continues to improve.
Last week, 44,779 new cases per day were recorded, the lowest since July 1 and down from over 70,000 cases per day in late July. Deaths per day from Covid-19 were also down to 1,017 over the past week, the lowest since July 30 and well below the over 2,000 deaths per day we witnessed in April at the peak of the coronavirus crisis in the US.
Recent data indicate that the US economy has so far managed to weather July’s sharp rise in Covid-19 cases, which some called the “second wave”. The increase in cases threatened business closures that could have knocked the recovery off course. The US Purchasing Managers Index (PMI) composite (MPMIUSCA in the chart below), a measure of manufacturing and services activity, rose to 54.7 from 50.3 in July, an 18-month high, with both sectors seeing a big increase. A reading above 50 is a sign of expansion while a reading below 50 is a sign of contraction in the economy.
Meanwhile, in Europe, the UK PMI composite (MPMIGBCA) rose to a seven year high of 60.3, indicating that the recovery has gained speed across both the manufacturing and service sectors since July.
The composite PMI for the Eurozone however fell to 51.6 in August from 54.9 in July, indicating its expansion has slowed. This comes as infections are again surging in Europe. Thankfully those affected have been much younger on average than during the first wave of the pandemic, and hospitalizations and deaths have been much lower. This makes it less likely that governments will revert to widespread lockdowns. Preventive quarantine measures however have pushed back the recovery in the European services sector, particularly its tourism industry, which has its busiest time of the year around now in the third quarter.
IHS Markit Composite Purchasing Managers Index (PMI) – August 2020
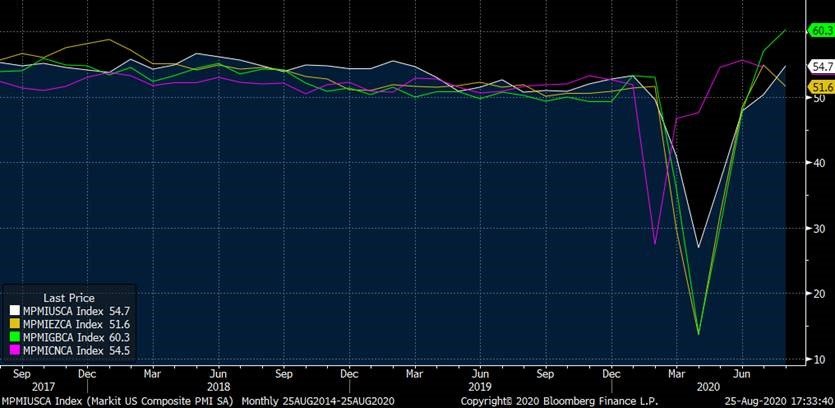
Source: Bloomberg, IHS Markit
Also, the housing data continues to be the most redeeming area of the US economy shaking off still high unemployment rate. The pandemic is reshaping where and how Americans want to live in a post Covid-19 world and home buyers have returned in force.
The July sales numbers were among the strongest the housing market has ever seen. Sales of previously owned homes jumped +24.7% from a month earlier to a seasonally adjusted annual rate of 5.86 million, according to the National Association of Realtors (NAR). That was the strongest monthly gain ever recorded, going back to 1968.
A big factor supporting housing demand – record low mortgage rates. In July, the average rate on a 30-year fixed mortgage fell to 2.98%, according to Freddie Mac, its lowest level in nearly 50 years of record-keeping. Also, buying surveys suggest housing demand looks strong in the near term. About 40% of home buyers polled by Realtor.com in June said they are looking to buy a home sooner because of Covid-19, while only 15% said the pandemic slowed down their timeline. Home sales can have positive knock-on effects as buyers spend on durable home goods and renovations.
Don’t just look at the encouraging data in the US! China, the second largest economy in the world is out of Covid-19 lockdown. Its restaurants and gyms are busy again and airport departure lounges are getting packed. This has led to economists at the World Bank and elsewhere upgrading their forecasts for China, the only major economy expected to grow this year.
Where do equity markets go from here?
Now that the SPX has erased all its losses from the Covid-19 meltdown, where do we go from here?
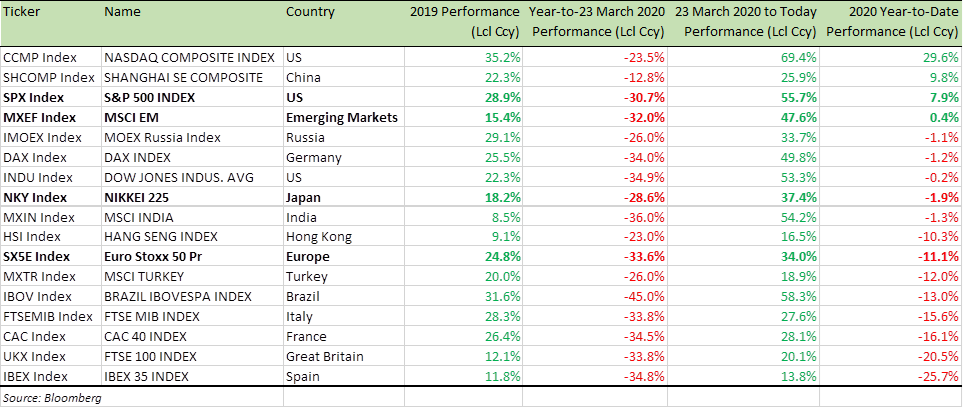
In my view, the risk is still to the upside albeit tech stocks look overvalued and could be in for a short term reversal. As the equity sector return table below indicates, outside of the tech and communications sectors (and a few consumer discretionary stocks such as Amazon), most sectors are still barely positive for the year.
Benchmark Equity Index Performance (2019 & YTD)
Most importantly, the fiscal stimulus is still in place and more is to follow as the CARES II deal takes shape in the US. Federal Reserve Chairman Jerome Powell and other Federal Reserve policymaker still seem concerned with the plethora of unknowns that could stall, or in the worst case, exacerbate downward pressure on growth. With low inflation and interest rates making the Fed’s conventional tools less powerful than before, Fed policymakers have been weighing inflation targeting – a policy of seeking to make up for periods of low inflation by allowing subsequent periods of somewhat higher inflation. The practical effect – it will be a very long time before interest rate increases are discussed, let alone actually raised. At the last Federal Open Market Committee (FOMC) meeting, most officials didn’t expect to raise interest rates at least through 2022.
All these, of course, are bullish risk and bullish equities.
I continue to be long equites with a bias to Consumer Staple (XLP) stocks which have more upside as the economy re-opens. I also favour Financials (XLF), Industrials (XLI) and Materials (XLB) stocks, which will play catch up. “Work from home” is good, but I refuse to believe it is a secular shift in a very meaningful way. When “back to work” returns, and it will, there will be a need for bigger infrastructure projects once again and for people and goods to move. The cost of capital will go up and industrial and material sector companies will be back in demand for their products and services.
Despite the surge in cases in Europe, there is room for a rally in European equities and indeed UK equities, which have fared badly when compared to their US counterpart (as the table above indicates).
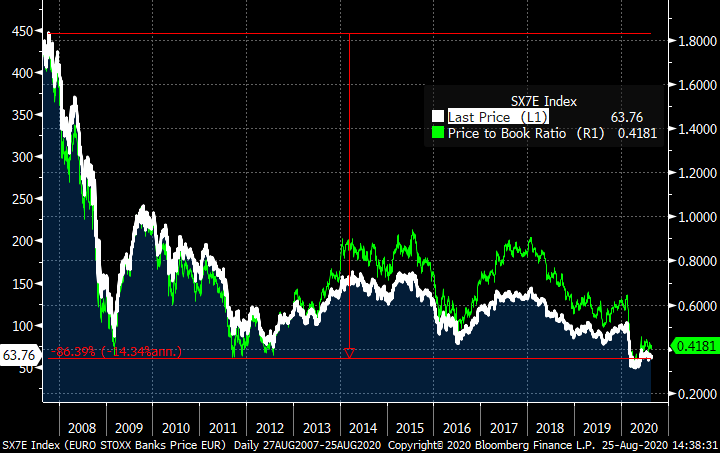
Talking about Europe, no sector has been as beaten down in the post 2007 Great Financial Crisis (GFC) world as Eurozone banks. The Eurostoxx bank index (SX7E) has lost -87% since its 2007 high and is down -36% this year alone. The market capitalisation of the entire index is now smaller than that of JP Morgan. This year Covid-19 induced losses on loan books, and the ECB’s advice to put a stop on dividend payments, both have hit the sector hard. All that is now behind us. A great deal of bad news is already reflected in the price. So is it time to look at Eurozone bank shares again?
Eurostoxx Bank Index (SX7E) – 2007 to today
Source: Bloomberg
As a tactical recovery trade, yes. It is amply clear that “Keynesian policies” and not “austerity” will be the buzzword in the Eurozone for few years. This week, Germany extended a program that has kept millions of Germans from losing their jobs. Chancellor Angela Merkel’s coalition agreed to extend until the end of 2021 the job-preserving subsidies known in German as “Kurzarbeit” that pay the bulk of pay checks and allow companies to hold on to workers during an economic shock. It will cost Germany 10 billion Euros, which the government can easily fund through bond issues with negative yield. Therefore, any upturn in economic activity from expansionary fiscal settings in Germany and other Eurozone nations could see under-performing Eurozone bank shares react first and by the most. For specific stock recommendations, please do not hesitate to get in touch.
Best wishes,

Manish Singh, CFA