The Chair of the US Federal Reserve, Kevin Warsh seems to be saying – stop looking to the Fed for forecasts and start focusing on the data.
Summary
Federal Reserve Chairman Kevin Warsh has inherited what many would argue is the most over-communicated institution in modern financial history. For much of the past decade, markets devoted as much attention to interpreting the Federal Reserve’s language, dot plots, speeches and forward guidance as they did to analysing the underlying economic data itself. Under Chairman Warsh, that dynamic appears to be changing.
In a world where economic indicators are often noisy, heavily revised and occasionally contradictory, the temptation for central bankers to over-explain and over-guide has been considerable. Warsh appears determined not merely to resist that temptation, but to reverse it altogether. Perhaps the most revealing aspect of this week’s FOMC meeting was his decision not to submit his own projections to the Fed’s “dot plot”, while encouraging other Committee members to continue doing so. This was no oversight. Warsh has repeatedly argued that dot plots are a flawed communication tool, that forward guidance can unnecessarily constrain policymakers, and that the Fed has spent much of the past decade over-promising and under-delivering on transparency. His absence from the projections was itself a powerful statement of intent. The message to markets was clear: stop looking to the Fed for forecasts and start focusing on the data.
Versailles has a complicated history when it comes to international agreements. It is therefore fitting that the newly signed U.S.-Iran accord should emerge from the same venue. The last truly consequential agreement signed at Versailles was the Treaty of 1919, celebrated at the time but viewed far less favourably by history. Whether the latest agreement proves more durable remains to be seen, but its geopolitical implications could be significant for both energy markets and investor sentiment.
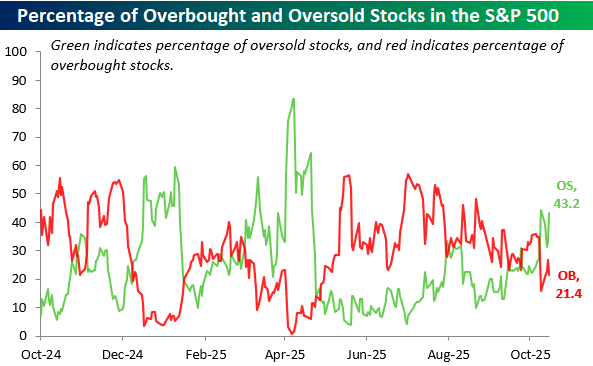
There are also reasons to believe inflation may continue to ease without further aggressive policy intervention. Historically, Google searches for the term “inflation” have tended to peak roughly six months ahead of CPI readings. Search interest reached a five-year high in March, suggesting inflation could peak around September if that historical relationship holds. Our base case remains for an extended policy pause, with the first rate cut potentially arriving in October or December should inflation prove more persistent than expected.
The broader investment backdrop remains constructive. Economic growth continues to demonstrate resilience, inflation is gradually moderating, and the labour market, while slowing, is not showing signs of significant deterioration. The path towards an S&P 500 at 8,000 and a Nasdaq 100 at 30,000 is unlikely to be linear. Periodic corrections and extended periods of consolidation should be expected. Nevertheless, the longer-term outlook for risk assets remains favourable.
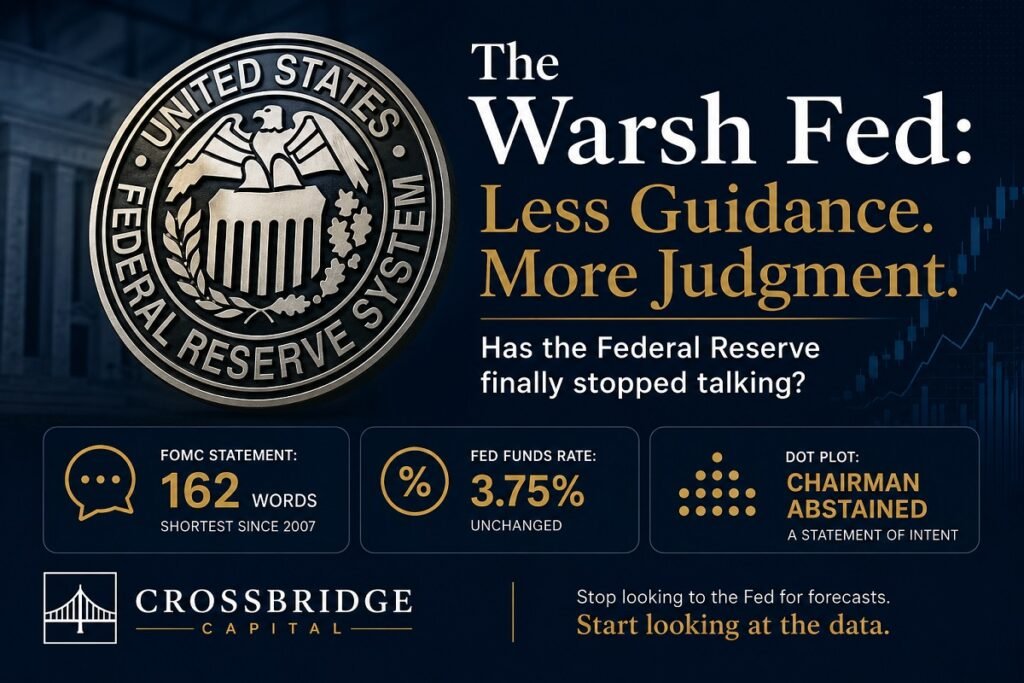
The Warsh Fed: Less Guidance, More Judgment
The U.S. Federal Open Market Committee (FOMC), under its new Chair Kevin Warsh, met this week and left the Federal Funds Target Rate unchanged at 3.75%.
The decision itself was not the most interesting part of the meeting. The statement was.
At just 162 words, it was the shortest FOMC statement since 2007. To find anything similarly concise, you would have to go back to the Alan Greenspan era in the early 2000s.
That brevity appears deliberate.
Warsh has inherited what many would argue became the most over-communicated institution in modern financial history. Over the past decade, markets often spent more time interpreting the Federal Reserve’s (Fed) ‘s language, dot plots, speeches, and forward guidance than they did analyse the underlying economic data.
The new approach seems to be the opposite.
Rather than pre-judging the economy, guiding markets toward a particular outcome, or signalling future policy moves months in advance, the Warsh Fed appears intent on restoring economic data as the primary signal.
The message is straightforward: Don’t look to us for clues about what comes next -look to the data. We will be doing the same.
It is a notable shift from recent years, when a single speech or phrase from the Fed Chair could move markets regardless of what the incoming data was saying. In a world where economic indicators can be noisy, revised, and sometimes contradictory, the temptation to over-communicate became overwhelming. Fed Chair Warsh appears determined to not just resist that temptation but to reverse that trend of overcommunication.
On data, he was equally direct: “Most of the data that central bankers consume come with old-fashioned survey methods – a national account of what the US economy looks like that looks very little like the US economy in 2026. Survey methods that don’t have response rates that we need, asking questions that might have been applicable a generation ago that are less applicable now.”
The Fed has been making trillion-dollar decisions with instruments built for a different economy. Warsh is saying that plainly and publicly. That alone is a departure.
There is something refreshing about a central bank that is trying to make itself less important and the data more important. I’d urge you to watch the full 45 minutes of the press conference.
It was brilliant.
US Federal Reserve Chairman Kevin Warsh at the FOMC press conference on June 17, 2026
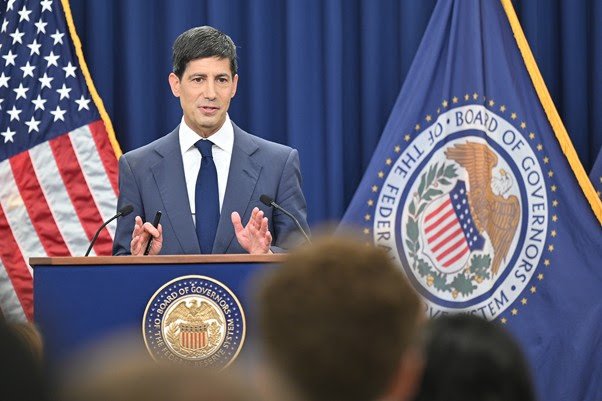
Source: US Federal Reserve
The FOMC statement itself was a masterclass in saying very little. Growth was described as “solid.” Productivity was “strong.” Job gains had “kept pace.” Unemployment was little changed. Inflation remained “elevated,” though pressure was attributed largely to “certain sectors, including energy.”
On a natural language processing scorecard, the statement managed to sound both hawkish and dovish at the same time—either a feat of careful ambiguity or a document intentionally engineered to reveal as little as possible. I suspect it’s the latter and that was likely the point.
If the FOMC statement told investors almost nothing, the Summary of Economic Projections (SEP) told a rather different story.
The median FOMC participant now expects one rate hike this year. Core inflation is forecast at +3.3%, remaining above target not only this year but into 2027. Unemployment forecasts were revised lower, and the projected policy path for 2026 and 2027 shifted by a cumulative 50 basis points.
The dots, in other words, were hawkish.
Perhaps the most revealing detail was that Warsh himself declined to submit projections to the SEP, while encouraging other members to continue doing so.
That was not an oversight.
Warsh has repeatedly suggested that dot plots are a flawed communication tool, that forward guidance often boxes policymakers into commitments they later regret, and that the Fed has spent the past decade over-promising and under-delivering on transparency. His absence from the projections, was itself a statement of intent.
The message to the market was clear: Stop looking to the Fed for predictions about the future and start looking at the data.
That philosophy extended beyond the statement.
Warsh announced five task forces to review Fed communications, the balance sheet, data sourcing, productivity and labour market measurement, and the inflation framework. Notably, he ruled out reconsidering the Fed’s +2% inflation target before the reviews had even begun.
The task forces may be entirely genuine. They may also serve as the mechanism through which Warsh pursues a deeper institutional redesign of the Fed. My interpretation, however, is somewhat different. By sending major questions to committees and review groups, Warsh is signalling to existing FOMC members that he is not planning a sudden overhaul.
Nothing changes immediately. Everything goes through a process. That approach buys time, builds consensus, and reassures colleagues who may be wary of rapid change. If Warsh wants to reshape how the Fed communicates and operates, he will need the broader FOMC on side. Committees provide a way to move the conversation forward without forcing immediate decisions.
Viewed in that light, these announcements amount to something much larger than a routine policy meeting. They suggest a Chair focused not simply on interest rates, but on gradually reshaping the institution itself.
Forward guidance is being de-emphasised. Verbose statements are disappearing. The Chair has personally abstained from the dot plot. Internal reviews are underway across nearly every major aspect of the institution’s communication and analytical framework. This is not tinkering around the edges. It is a structural review of how the Federal Reserve thinks, speaks, and acts.
The irony is exquisite: The most significant shift in Fed communication philosophy in two decades was delivered in just 162 words.
Greenspan would probably have approved. The dot plot almost certainly would not have survived his tenure.
Less guidance, more judgment and more attention to economic data and less attention to central bankers trying to forecast the future.
After a decade in which markets often reacted more to Fed rhetoric than to economic reality, that may be the most important policy change of all.
The reporters gathered at Fed press conference were demonstrably frustrated that Warsh wouldn’t give them the forward guidance headline.
That frustration is precisely the point. Journalists who covered the Fed under Jerome Powell and Janet Yellen learned to listen for the coded signals, parse the adjectives, and write the market-moving headline.
Warsh is withdrawing that service. If you want to write about where rates are going, look at the data, build an argument, and write like an analyst. The Fed is no longer in the business of doing that work for you.
Welcome to a new Fed. Welcome to the Warsh Fed.
Markets and the Economy
Versailles has a complicated history when it comes to international agreements. It is therefore fitting that a new U.S.-Iran agreement has been signed there of all places.
The last truly famous document signed at Versailles was the Treaty of 1919. It was celebrated at the time. History has since delivered a rather different verdict..
This latest agreement is not technically a treaty but rather a Memorandum of Understanding (MoU). Investors may prefer to think of it as a Letter of Intent (LOI). The challenge, as always with LOIs, is determining what the real intent is and whether it ultimately translates into action.
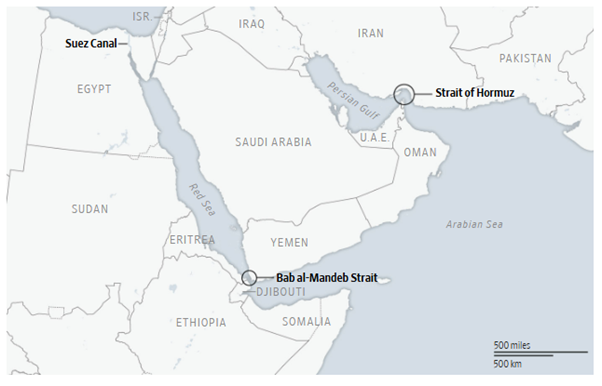
For now, two immediate positives stand out: A reduction in geopolitical tension and the reopening of the Strait of Hormuz.
The latter matters enormously. Roughly a fifth of global oil trade passes through the Strait, making it one of the most strategically important waterways on earth. The first captain willing to sail a fully loaded container ship through Hormuz after the reopening deserves a trophy larger than the World Cup.
Longer term, however, I suspect the agreement may accelerate a trend that was already underway: A global reappraisal of security guarantees.
Over the next decade, I would not be surprised to see a significant increase in defence spending, including renewed debates around nuclear deterrence in countries that currently lack it. From East Asia to the Middle East, many U.S. allies will increasingly ask themselves whether external security guarantees are sufficient in an era of shifting geopolitical priorities.
The most memorable moment, however, came after the signing ceremony.
Trump finished signing. Macron leaned over and said, “Good job.” The room applauded.
Then Trump turned directly toward the cameras, made a deliberate hand gesture, and delivered his entire market assessment in four words:
“Oil down. Stocks up.”
That was it.
No lengthy diplomatic statement. No strategic doctrine. No detailed geopolitical analysis.
Just four words.
Whether one views him primarily as President, negotiator, or market participant, it was a reminder that Trump often sees world events through an investor’s lens – it was a reminder that Trump often sees world events through an investor’s lens. At that moment, the foreign policy briefing and the market commentary became one and the same.
Oil down. Stocks up. The Portfolio Manager-in-Chief had spoken.
US President Donald J. Trump signs the Iran Memorandum of Understanding, Versailles, June 17, 2026
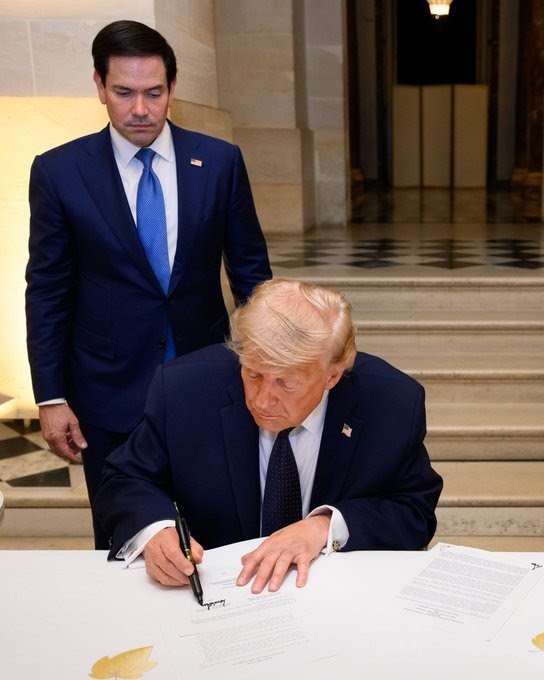
Source: White House
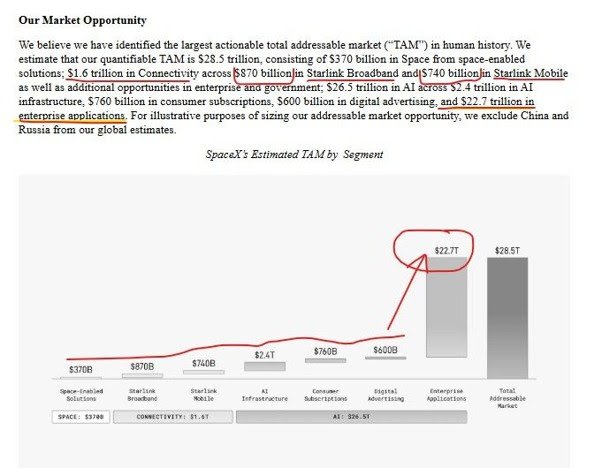
SpaceX is now a public company. The company claims perhaps the largest actionable Total Addressable Market in history: $28.5 trillion.
The rockets, satellites and launch infrastructure are what made SpaceX famous. They also made Elon Musk one of the great innovators of our time.
But look closely at the numbers.
- Enterprise AI applications account for $22.7 trillion of the claimed TAM. That is roughly 80% of the total.
- Space itself—the business SpaceX is best known for—accounts for just $370 billion, or around 1.3%.
- Add Starlink broadband and mobile, and the businesses generating real revenue and profit today still represent less than 7% of the TAM being presented to investors.
In other words, if you are buying SPCX, you are not simply buying a rocket company. You are buying an AI enterprise software company that happens to own the world’s best rocket business.
That distinction matters.
The AI segment—xAI, X, Grok and Colossus compute – is currently losing around $6.4 billion a year. Starlink is the only profitable segment.
Source: SpaceX S-1 document for IPO, June 2026
The valuation is equally demanding.
At a $1.75 trillion valuation, SpaceX trades at roughly 70x forward revenue. For context, the median technology company trades around 3x, Tesla around 14x, and NVIDIA around 18x.
There is no question the company has extraordinary assets. Starlink has a powerful moat. Starship could change the economics of space. Grok reportedly has 117 million monthly active users and is scaling quickly. But the stock is asking investors to price a vast amount of future revenue today.
In June 2026, this is still a company losing $4.3 billion per quarter, with 80% of its claimed TAM tied to businesses that have little to do with rockets or satellites.
So, the question is simple: Is SPCX the next Mag 8 name, or the most spectacular amount of pixie dust ever packaged in a prospectus?
Let’s see where the stock is trading when various lockups start expiring from mid-August.
Turning to broader equity markets and looking at Indian equities which we don’t do much often in these pages unless I have a lesson to share.
When every investor is overweight the same story, ask yourself a simple question:
Who’s left to buy?
Two years ago, India was the world’s favourite equity market. Every institutional investor wanted exposure. The narrative was irresistible: demographics, digitisation, manufacturing growth, and the “China alternative.”
By mid-2024, MSCI India was trading at more than a 100% premium to the broader Emerging Markets index – the widest valuation gap versus Asia-Pacific peers in two decades.
Consensus was unanimous.
Then reality arrived.
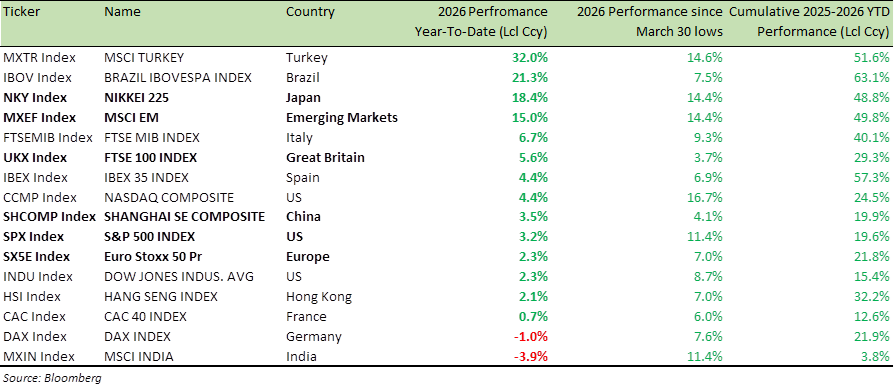
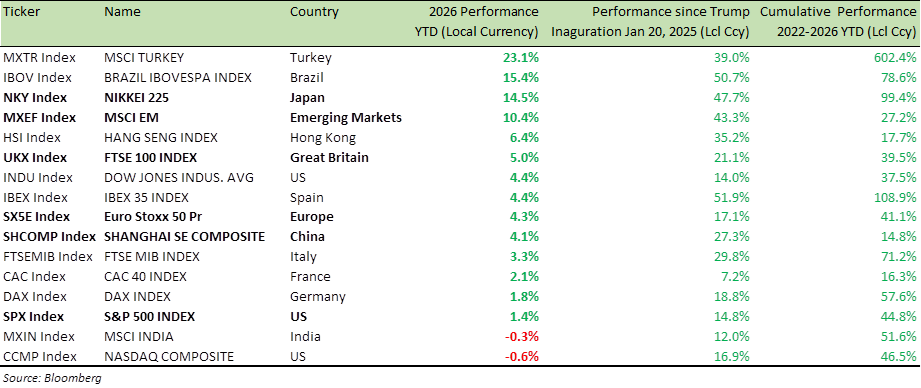
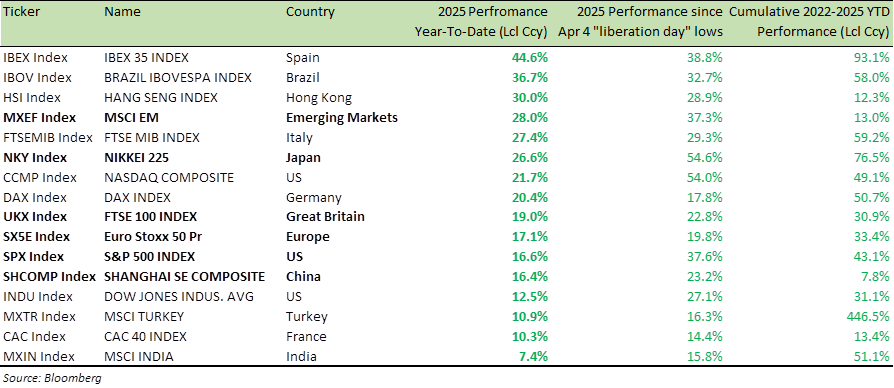
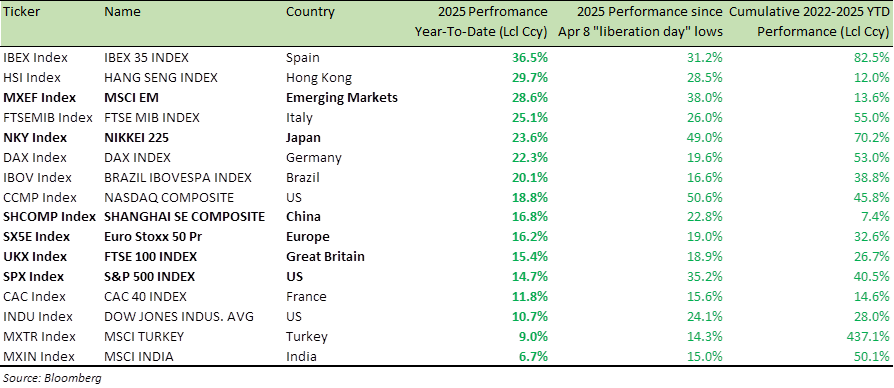
MSCI India is down -4.4% year-to-date in 2026 and has delivered just +3.3% cumulatively across 2025 and 2026. It ranks last in the MSCI universe, with every major peer outperforming, some by more than 70 percentage points.
Global Equity Index Performance (2026 YTD and 2025-26 YTD)
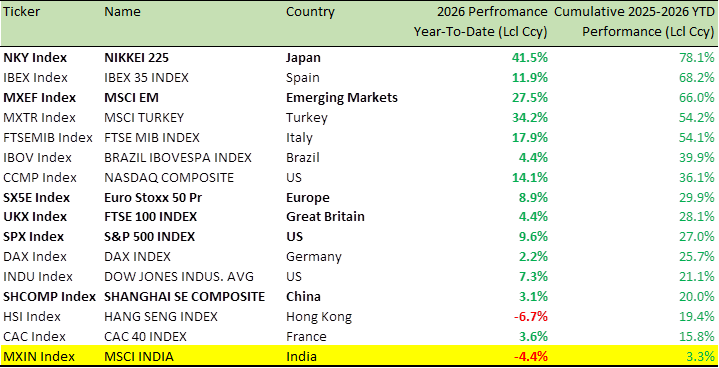
For dollar-based investors, the picture is even worse. The rupee has fallen more than -9% against the dollar over the past year, turning a modest local-market decline into something much closer to a -15% drawdown.
So, what went wrong?
Arguably, very little.
India remains India. Bureaucracy has improved but remains burdensome. Reforms continue, but more slowly than hoped. Policy uncertainty still appears from time to time. None of this is particularly new.
What changed was the price investors were willing to pay.
At around 24x forward earnings—roughly 27% above its own long-term average -the market had already priced in near-perfect execution of a decade-long growth story.
Markets don’t reward stories. They reward positive surprises.
And when expectations become extreme, even good outcomes can disappoint.
As capital rotated into China’s recovery, AI infrastructure, and other emerging markets, India’s premium left investors with little margin for error.
The lesson extends far beyond India.
Narrative is not valuation. Consensus is not a margin of safety. And the most crowded trade rarely ends well.
India may still prove to be a generational investment opportunity. But a great story and a great investment are not the same thing.
The price you pay determines the return you get, not the narrative and not the consensus, and certainly not the slides in the pitch deck.
In the US, going back to 1930, every Federal Reserve Chair has seen stocks decline during the first three months of their tenure, including Eugene Meyer, who served through the depths of the Great Depression. The question now is whether Kevin Warsh will be the exception.
Recent developments may improve his odds.
President Trump announced the recent deal with Iran, and over the past four weeks, the economic data has painted a clear picture.
The U.S. economy remains resilient. Retail sales surprised to the upside, rising +0.9% in May.
The labour market remains healthy, with unemployment around 4.3% and jobless claims near historical lows.
Consumer sentiment has improved modestly as fuel prices eased.
The challenge remains inflation, with headline CPI back above+ 4% and the Fed’s own forecasts showing inflation remaining above target into 2027.
The economy is not weak enough to justify rate cuts today. But neither is it overheating enough to justify rate hikes.
That is why the growing discussion around further tightening looks misplaced.
Raising rates into an oil-driven supply shock does not solve the underlying problem; it risks slowing growth while having limited impact on the source of inflation.
The Fed made a major analytical mistake in 2021 by holding onto the “transitory” narrative for too long. The danger now is overcorrecting and tightening policy simply to prove that lesson has been learned.
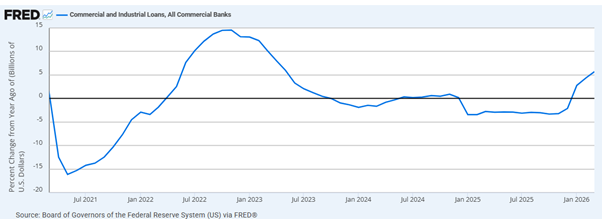
There are reasons to believe inflation may cool on its own.
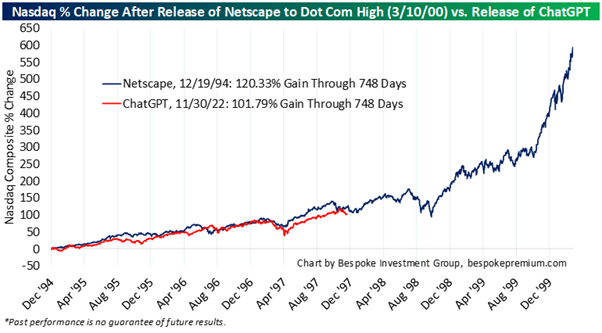
Historically, Google searches for “inflation” have tended to peak roughly six months before CPI. Search activity reached its highest level in five years in March (chart above). If that relationship holds, inflation could peak around September.
My base case remains unchanged. No rate hike and no rate cut at the next two FOMC meetings. The most likely outcome is a prolonged pause, with the first potential rate cut coming at the October meeting – or perhaps December if inflation proves more stubborn than expected.
For now, patience is the correct policy. The Fed’s job is not to react to every headline but to determine whether today’s inflation pressures are temporary or persistent.
Warsh’s first major test may not be whether he can defeat inflation. It may be whether he can avoid fighting the last inflation battle all over again.
Bottom line: Growth is still solid, inflation will cool opening path to at least one rate cut this year, and the labour market is bending, not breaking.
The journey to the S&P 500 at 8,000 and the Nasdaq 100 at 30,000 will not be linear. Periodic selloffs and extended sideways phases are inevitable along the way.
That’s precisely where equity structured products come into their own. Used thoughtfully, they are an effective way to navigate and potentially monetize-higher volatility. These strategies can offer partial capital protection, help define disciplined entry levels, and generate returns even when markets move sideways or pull back.
For tailored ideas, stock-specific structures, or deeper insights, please reach out to me or your dedicated relationship manager.
Best wishes,

Manish Singh, CFA