As MAGA returns to Washington, should President Trump advocate for more tariff or smaller Government?
Summary
As President Donald Trump embarked on his second term, he immediately set forth expansive plans to revamp immigration, the economy, and the justice system, including lifting the TikTok ban, demonstrating his intent to make impactful decisions quickly. For those worried about Congress limiting the President’s deal-making authority—which could affect U.S.-China relations—referencing the 1937 United States v. Belmont case is instructive. It highlights the considerable powers a President has to negotiate agreements independently of Senate or House interference.
While many pundits predict another tariff war with China, it’s more plausible that Trump will negotiate aggressively to forge a beneficial US-China deal. Such an agreement could rejuvenate the fortunes of America’s rust-belt regions, neglected by previous administrations, and potentially ignite a rally in Chinese equities, commodities, and related markets.
Targeted tariffs will continue to be a crucial strategy for protecting U.S. economic and international interests. However, in today’s global economy, the impact of broad tariffs as a major revenue source is considerably diminished. The real answer to America’s fiscal challenges lies in reducing government size, cutting regulations, and lowering taxes, as incoming Treasury Secretary Scott Bessent emphasized, pointing out America’s “spending problem” rather than a revenue issue.
With the resurgence of the “drill baby drill” policy, we anticipate significant reductions in energy costs this year. Despite signs of weakening in the labour market, I expect the Federal Reserve to implement more than two rate cuts this year. Questions about the Fed’s independence persist, especially under pressure from President Trump, who is likely to criticize the Fed at any sign of labour market downturn, pushing for aggressive rate cuts—which the “independent” Fed is likely to enact.
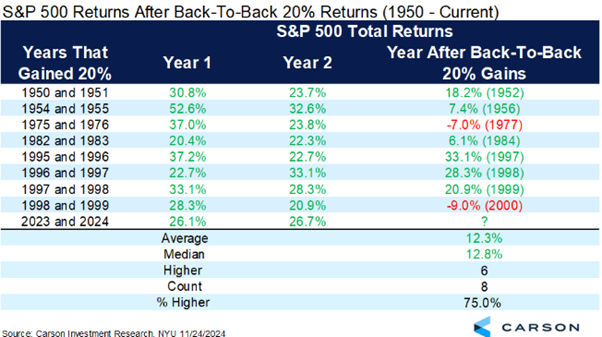
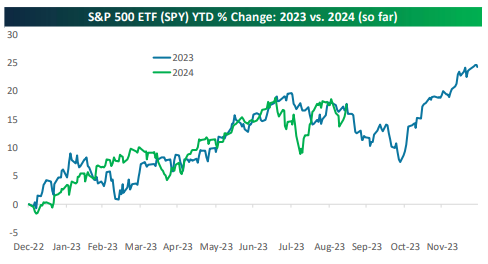
For market sceptics who have dismissed the recent bull market trends as merely a bear market rally, attributing it to various factors from greed to FOMO, the first quarter may prove challenging as the S&P 500 is set to climb higher.
MAGA returns to Washington
President Donald Trump is back—and he’s not holding back. Four criminal cases and a near-miss assassination couldn’t stop him. Sworn in as the 47th President, he thundered: “The golden age of America begins right now,” and unleashed sweeping plans to overhaul immigration, the economy, and the justice system.
Before addressing tariffs, the President’s issued day-one executive orders, with market implications and potential consequences for the future.
On Monday, hundreds of crypto executives and political power players gathered in the nation’s capital to toast what they believed would be a golden age for digital assets under the Trump administration. What they didn’t expect was Trump’s own foray into the meme coin frenzy.
“It’s time to celebrate everything we stand for: WINNING! Join my very special Trump Community. GET YOUR $TRUMP NOW,” Trump announced on Truth Social at 9 p.m., catching everyone off guard. A day later, Melania Trump upped the ante, revealing her own token, $MELANIA.
But the shocks didn’t stop there.
On Tuesday, at 11:38 a.m. (ET)—just 22 minutes before his Presidency officially ended— President Joe Biden issued sweeping, unconditional pardons for his siblings and their spouses. Earlier, Biden granted similar clemency to several prominent Trump critics, including Gen. Mark Milley and Members of Congress who investigated the Capitol riot on Jan. 6, 2021.
These “pre-emptive” pardons unprecedented in history of America, can have a huge bearing in the future. Trump and those that follow him, can now greenlight illegal actions by members of their administration, friends, or family, allowing them to operate without fear of consequences, knowing they will be pardoned. This opens the door to the alarming prospect of a lawless administration, whether driven by self-enrichment or the goal of undermining opponents.
As history echoes back to 1787, when Benjamin Franklin famously remarked that the Constitutional Convention had given the nation “a republic, if you can keep it.” This question now looms larger than ever.
What will the next four years bring? Will the republic endure, or will the boundaries of power be tested beyond repair?
Trump Returns: A New Chapter in the Oval Office
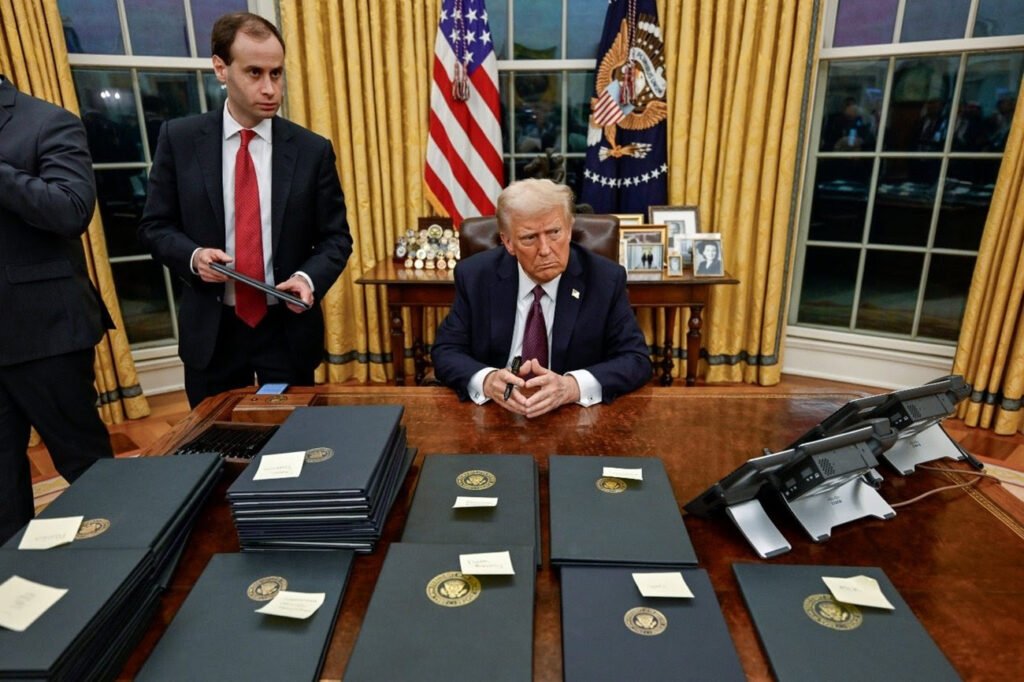
Source: The White House @WhiteHouse
Moving on to markets and the threat of tariffs.
At a hedge fund (HF) macro dinner last week—and during a breakfast meeting four weeks earlier with portfolio managers from several key HFs—I was struck by the strong views on tariffs and the possibility that Congress could limit the President’s authority in foreign policy. Such restrictions could hinder efforts to “ease” relations with China, a prospect causing considerable unease among market participants.
To understand the breadth of presidential power in this arena, one must revisit the landmark 1937 United States v Belmont case. This case emerged from the aftermath of the Soviet Revolution, during which the Bolsheviks seized and nationalized various industries and assets, including some held in the US.
Justice George Sutherland, delivering the Supreme Court’s opinion, affirmed that the external powers of the United States are exercised independently of state laws or policies. Article II, Section 3 of the Constitution grants the President authority to conclude binding agreements with other nations, underscoring the executive branch’s pivotal role in shaping international relations.
A summary of the case and context:
- U.S. v. Belmont (1937) examined whether the president could make binding legal agreements with foreign states. The case arose after the Bolshevik Revolution, which left ownership of some US-held assets unclear.
- In 1933, President Franklin Roosevelt recognised the Soviet Union and negotiated the Litvinov Assignment, an executive agreement to settle mutual claims. It transferred American-held assets of Russian companies to the Soviet government and vice versa, aiming to normalise relations.
- August Belmont Co., a New York bank holding Russian assets, challenged the agreement, arguing the president lacked constitutional authority to make binding agreements without Senate approval. New York state courts sided with Belmont, dismissing the lawsuit, citing conflict with state public policy against confiscating private property.
- The Supreme Court unanimously reversed this decision, affirming the president’s authority to recognise foreign states and use executive agreements, which are part of the “supreme Law of the Land” and override conflicting state laws.
- This ruling, reaffirmed in U.S. v. Pink (1942), established executive agreements as a constitutional tool in foreign policy, bypassing Senate ratification and expanding presidential flexibility in diplomacy.
This precedent highlights the significant implications of any congressional moves to curb the President’s executive power in trade and foreign policy—particularly as markets brace for potential tariff shifts.
This doesn’t rule out the use of higher tariffs—or the threat of them—as a negotiation tool. However, it underscores the significant power the President wields to strike deals, bypassing Senate or House constraints.
Trump wasted no time in lifting the ban on TikTok, signalling his readiness to act decisively. While many anticipate another tariff war with China, I believe a more likely scenario, is Trump driving a tough bargain to secure a mutually beneficial US-China agreement. Such a deal could revitalize the fortunes of Americans in rust-belt states, long overlooked by successive administrations, and potentially spark a rally in Chinese equities, commodities, and related markets.
Staying on Tariffs: Should Trump Advocate for More Tariffs or Champion Small Government and Lower Taxes?
The answer is clear: The latter.
To understand why, let’s look back at history and examine the plausibility of tariffs as a significant revenue source—starting with a chart that highlights tariffs’ limitations.
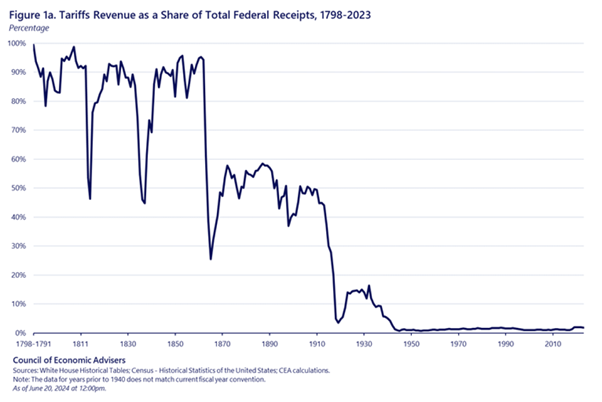
Strategically targeted tariffs remain a valuable tool for safeguarding the economic and international interests of the United States. However, in today’s interconnected global economy, the effectiveness of broad tariffs as a significant revenue source is severely limited. Elevating federal reliance on tariff revenue would likely worsen long-standing income inequality by shifting more of the tax burden onto lower-income households, while also introducing severe negative distortions to the broader economy.
In the late 18th and early 19th centuries, higher tariffs were essential for protecting the nascent US economy and its fledgling industries.
In the early 19th century, US industrialisation focused on labour-intensive industries like textiles, relying on imported machinery and exporting raw materials, leading to trade deficits. Protective tariffs supported emerging industries, while access to imports boosted development. Post-Civil War, industrialisation shifted to capital-intensive mass production, driven by advanced techniques and railroad expansion.
From 1870 to 1914, the US achieved trade surpluses, reducing import dependence, and increasing exports of manufactured goods during rapid economic growth. By the early 20th century, the US had emerged as a global industrial leader, running sustained trade surpluses. As its manufacturing base matured and exports outpaced imports, tariffs became less necessary and began to decline.
Over the next 70 years, US manufacturing dominance and innovation drove sustained trade surpluses, reinforcing the country’s economic strength.
Today, tariffs are no longer a critical revenue source. Consider the fiscal year 2023:
- Revenue Comparison: Tariffs generated $80 billion—just a fraction of the nearly $2.2 trillion collected in individual income taxes.
- Limited Impact: With $3.1 trillion in goods imports last year, even a universal tariff of 70% (unrealistic in practice) would barely replace individual income tax revenue, as such tariffs would decimate import levels.
It’s worth noting that 1913 saw the introduction of income tax, which significantly fuelled the expansion of the federal government.
The US federal government’s size and revenue needs have expanded dramatically since Alexander Hamilton’s tenure as Treasury Secretary in 1789. Even then, tariffs alone were insufficient to cover spending. Today, tariffs play a minimal role in federal funding, reflecting the evolution of the US economy.
If you think tariffs had little impact on the trade deficit during Trump 1.0, just imagine the fallout from a proposed 10% general tariff across the board. It won’t be the “big”, “beautiful”, “massive” win that Trump desires.
The true solution to America’s challenges lies not in higher tariffs, but in shrinking the size of government, reducing regulation, and lowering taxes.
As incoming Treasury Secretary, Scott Bessent aptly stated, “We do not have a revenue problem in the United States of America; we have a spending problem… This spending is out of control.”
As Trump 2.0 begins, the presidential stock market scorecard resets.
During Biden’s presidency, the Dow Jones Industrial Average (Dow) gained +39.4%—18 percentage points below Trump 1.0’s performance but still marking the third consecutive term of strong gains. While Biden’s Dow performance was the weakest of the last three presidents, it’s far from insignificant and places him among the top ten performing presidents since 1900.
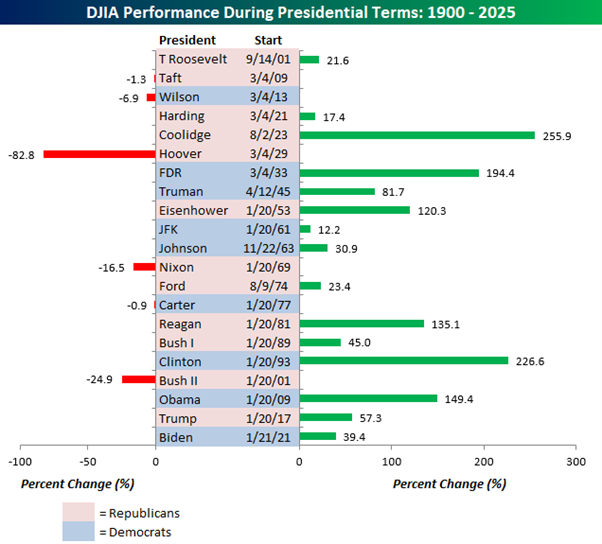
Source: Bespoke Invest
Politics and markets operate on completely different dynamics, as businesses adapt to the policies and politicians of the moment.
Take all the Tech leaders who are now lining up to “kiss the ring” of Trump, despite having largely “sided” with his opponents over the last eight years.
In 2008–09, many investors who feared Obama’s so-called “leftist” policies missed out on a +149.4% rally in the Dow.
The same pattern repeated with scepticism around Trump in 2016 and Biden in 2020—both of whom delivered strong market returns despite being labelled a “dictator” and a “socialist“ respectively.
Let’s see what next four years bring!
Markets and the Economy
This week, Scott Bessent, President Trump’s pick for Treasury Secretary, appeared before the Senate Finance Committee, for his confirmation hearing.
There were several nuggets but this response to Senator Ron Wyden (D-OR) stood out for me.
WYDEN: “We’re in a clean energy arms race with China. Which side are you on?”
BESSENT: “China will build a hundred new coal plants this year. There is not a clean energy race. There’s an energy race.”
Bessent sought to ease concerns about Trump’s tariff proposals—especially the pledge for universal tariffs on imports—by arguing that factors like currency fluctuations and the actions of foreign exporters would mitigate potential inflation.
According to Bessent, a 10% universal tariff would likely cause the dollar to appreciate by approximately 4%, preventing the full tariff cost from being passed on to consumers. Moreover, he suggested that foreign manufacturers, particularly those in China, might lower their prices to maintain market share, further reducing the tariffs’ impact on consumer prices.
Bessent said Trump has “a generational opportunity to unleash a new economic golden age that will create more jobs, wealth and prosperity for all Americans.”
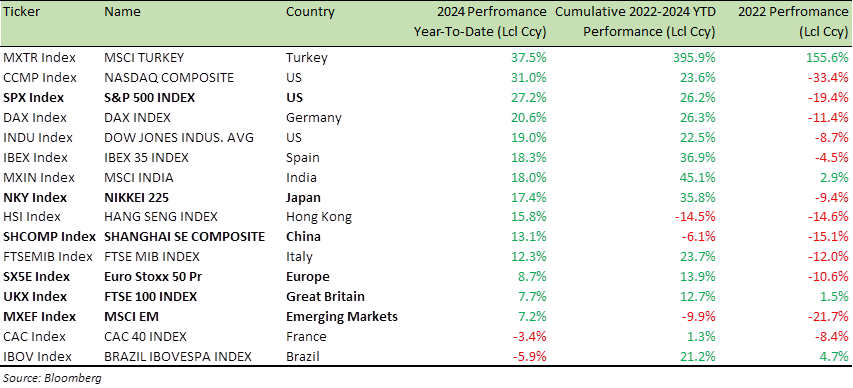
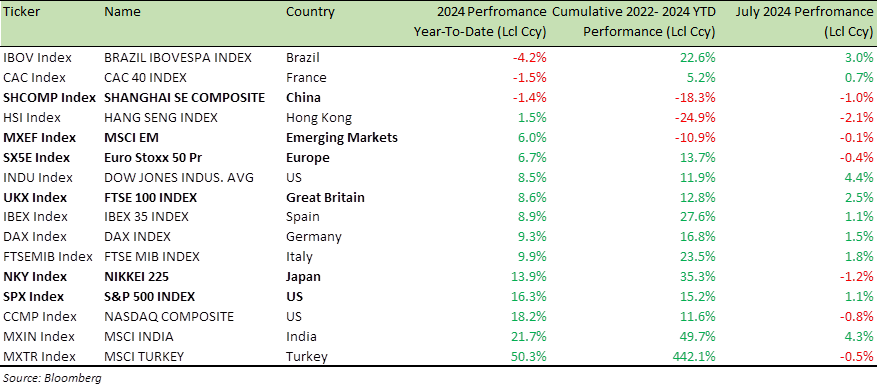
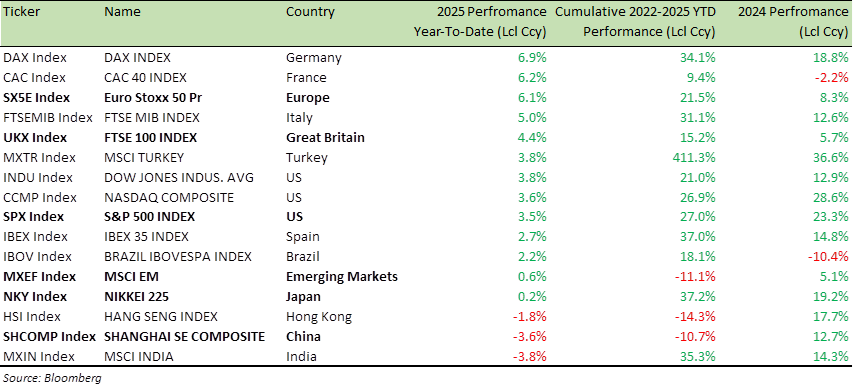
Global Equity Index Performance (2025 YTD, 2022-2025 YTD and 2024 Performance)
On Monday, legendary investor Stan Druckenmiller appeared on CNBC and shared his perspective on the new administration:
- “I’ve been at this for 49 years, and it looks like we’re shifting from the most anti-business administration to the exact opposite”
- “From our conversations with CEOs and companies on the ground, I’d say they’re feeling somewhere between relieved and outright giddy.”
A record-low percentage of countries are expected to be in recession in 2025 and 2026. (see chart below)
Is this a case of everyone finally jumping on the same side of the boat after repeatedly getting the recession call wrong?
Thanks to social media, the battle between bulls and bears has become more dramatic than The Lord of the Rings.
Regardless of the data, there’s always someone predicting a recession. The mantra seems to be – good news can’t last forever.
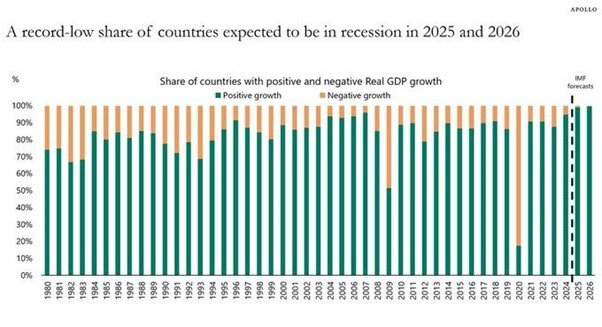
Source: Apollo
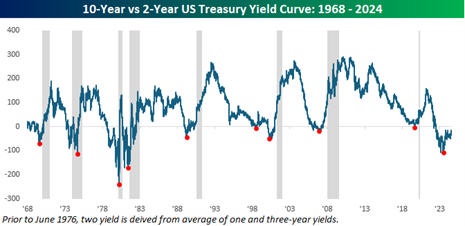
While much focus is placed on the US 10-year yield, attention should instead centre on the 10-year breakeven yield—the difference between nominal and real yields—which is widely regarded as a market-implied gauge of inflation expectations.
Over the past 2.5 years, breakeven have remained range-bound, signalling that markets are not overly concerned about inflation. The recent rise in 10-year yields reflects the market pricing in fewer rate cuts rather than inflation fears. However, expectations around rate cuts could shift again.
Could the 10-year yield reach 5%?
Yes, this is possible.
Here’s a straightforward breakdown of the math behind the 10-year bond yield:
- 2% inflation target + 0.25% inflation risk premium
- 2% real GDP growth + 0.25% growth risk premium
- 0.5% term premium
Total: 5%
Alternatively:
If growth falls short and drops from +2% to +1%, the 10-year bond yield could decrease to 3.5% or lower.
I’d be happy to lock in 4.5% on the 10-Year, as I do expect yields to go lower by the end of year and the US Federal Reserve (the Fed), to cut rates more than twice this year.
I say that because energy costs are set to decrease significantly over the year.
In my view, energy prices are by far the most influential drivers of inflation, with the labour market coming in as a secondary factor (after all, a strong labour market is generally a positive, unlike these inflationary pressures).
The final point that’s often overlooked is Trump is in the (White) House.
Do we really believe the Fed will remain fully independent? And Fed Chairman Jerome Powell can ignore what Trump says?
As soon as there’s a hint of weakness in the labour market, Trump will likely blame the Fed for not acting sooner, and he will exert heavy pressure to push for rate cuts and I can assure you the “independent” Fed will follow suit.
Also, we should not underestimate the deflationary potential of AI, which could serve as a balancing force in the “animal spirit” economy.
5-year price chart: US 10-Year breakeven yield (USGGBE10) and US 10Y Treasury yield (USGG10YR)
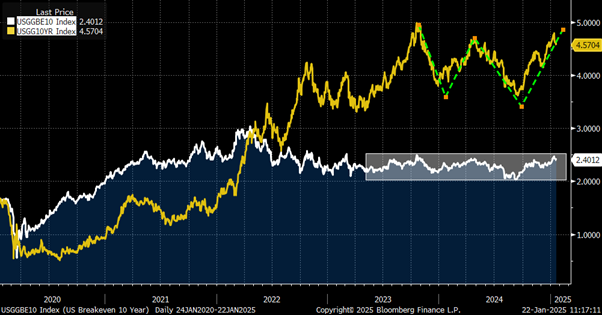
Source: Bloomberg
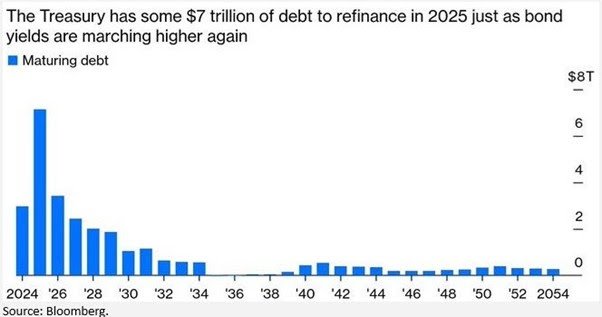
The US Treasury faces a significant amount of debt issuance over the next 12 months (see chart below), and maintaining Fed funds rates at current levels seems counterproductive, especially as inflation appears to have bottomed out. The only factor keeping headline inflation from approaching the +2% target is the distortion caused by “rents.”
In the most recent data, the core Consumer Price Index (CPI)—which excludes volatile food and energy prices—increased by just +0.2%, the smallest gain since July and below economists’ expectations of a +0.3% rise.
Headline CPI remains anchored in the +3% range, driven largely by owners’ equivalent rent (OER), which constitutes about 37% of the CPI basket. OER has moderated, with a year-over-year increase of +4.8% in December, down from +6.3% the previous year.
New tariffs didn’t materialize on Day 1 of Trump’s second term, as many had feared. For now, it seems a full-blown trade war may also be off the table.
Instead, Trump has directed his administration to investigate why the US trade deficit in goods continues to widen and to provide a compelling case for why this poses a national security risk.
Agencies tasked with this review face an April 1 deadline to report back, potentially setting the stage for new tariff proposals or hikes. By then, the Senate is expected to confirm two key figures in shaping and implementing these policies: Howard Lutnick as Commerce Secretary and Jamieson Greer as U.S. Trade Representative.
For those who’ve spent the past two years fighting this bull market—dismissing it as a bear market rally or blaming the yen, the Fed, valuations, buybacks, greed, FOMO, memes, bubbles, and more—it looks like Q1 may bring more pain.
Sorry!
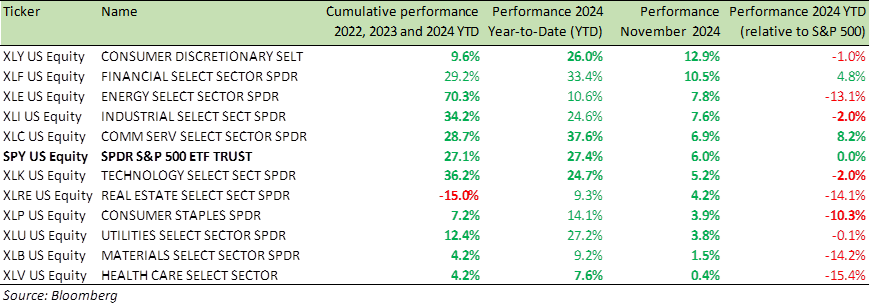
Benchmark US equity sector performance (2023-2025 YTD, 2025 YTD, Since Nov. 5 US election, and 2025 YTD relative to the S&P 500 Index
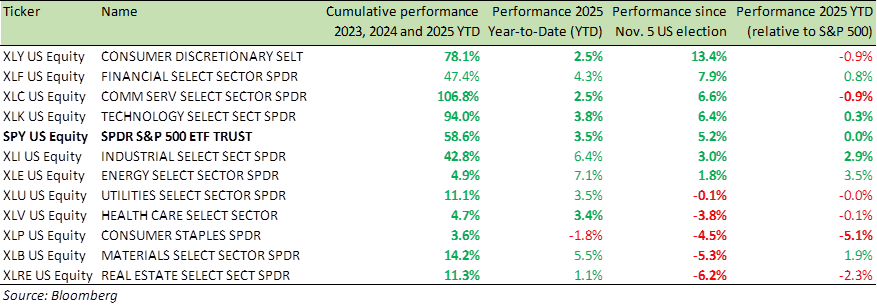
Materials (XLB), healthcare (XLV), and consumer staples (XLP), appear particularly appealing as interest rates decline and recession fears recede. These sectors have underperformed the S&P 500 (see table above) by more than 40% over the past three years, making them potential opportunities for investors.
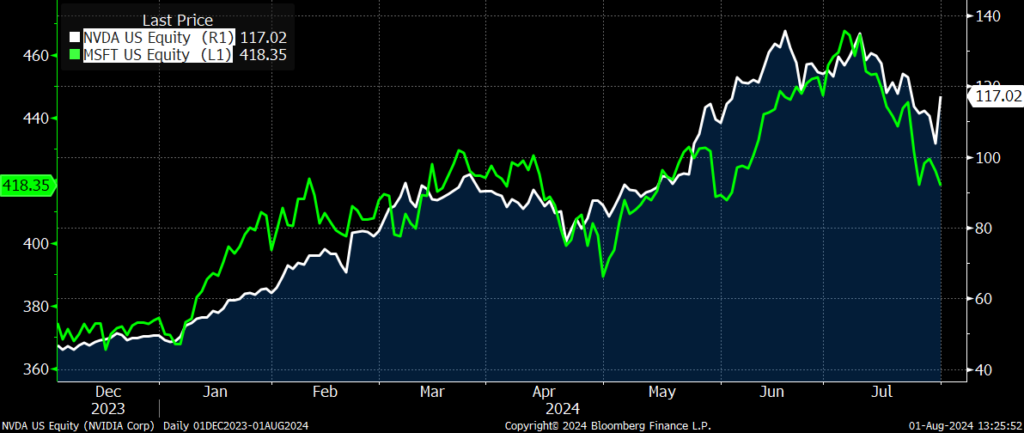
Tech (XLK), Communication Services (XLC), and semiconductor stocks have further room to grow as Trump doubles down on his “Make America Great Again” agenda. His announcement yesterday on Artificial Intelligence (AI) is a prime example. Trump’s message to the AI community is clear: Build aggressively and keep the US ahead of China in AI development, contrasting with the Biden administration’s more cautious stance on AI and its societal implications.
Also, since Trump is back, expect market volatility and drawdowns to increase as the market wakes up to his posts on social media. However, these are not anomalies, but rather inherent features of investing and should be anticipated, embraced, and strategically addressed. Predicting short-term market movements can be extremely challenging.
Hence, I highlight the value of equity structured products, as a highly effective investment tool to manage and potentially capitalize on increased market volatility. These products offer a degree of capital protection, while helping to identify advantageous entry points. They also present opportunities to generate returns, even in flat or declining market conditions.
For specific stock recommendations and insights related to structured products, please do not hesitate to reach out to me or to your dedicated relationship manager.
Best wishes,

Manish Singh, CFA