There’s nothing spooky about the recent equity market sell-off, we are peak rates, inflation is coming down fast.
Summary
US GDP grew at the annualised rate +4.9% in Q3 2023, a notable improvement from the +2.1% in Q2. Arguably, one of the most noteworthy highlights from the GDP data, was the significant decline in core PCE (Personal Consumption Expenditure) inflation. The Core PCE increased by +5.0% in Q1, +3.7% in Q2, but then markedly slowed to +2.4% in Q3. This brings it much closer to the +2% target set by the US Federal Reserve. This combination of diminishing price hikes and a resilient economy, augurs well for the prospect of a soft-landing scenario in the US, whereby inflation recedes without triggering a recession.
The S&P 500 is down -10% from its July high. Many stocks are not overvalued, and a significant portion of them have experienced no growth over the past 12-24 months, due to the notable rise in interest rates. In fact, at present, there are only two sectors – communication services and technology – that have outperformed the S&P 500 in the last twelve months.
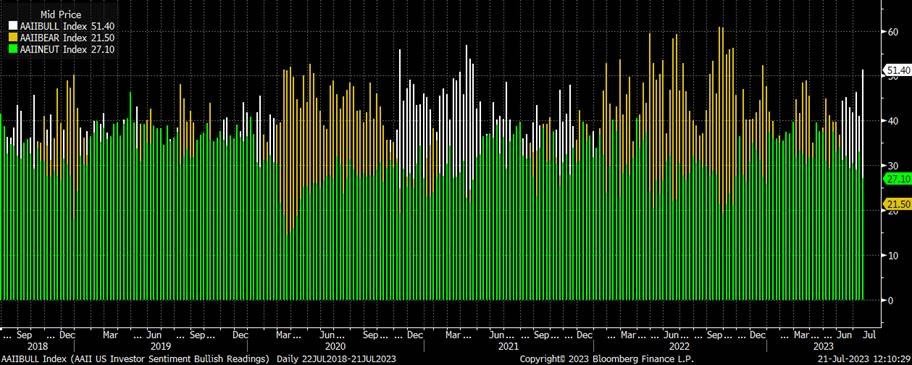
As per the American Association of Individual Investors (AAII) survey, bearish sentiment has surged by 8.6 percentage points in just one week, marking the most substantial weekly increase since February. The bearish sentiment now surpasses the bullish sentiment by a margin of 13.9 percentage points, which is the widest gap seen since May.
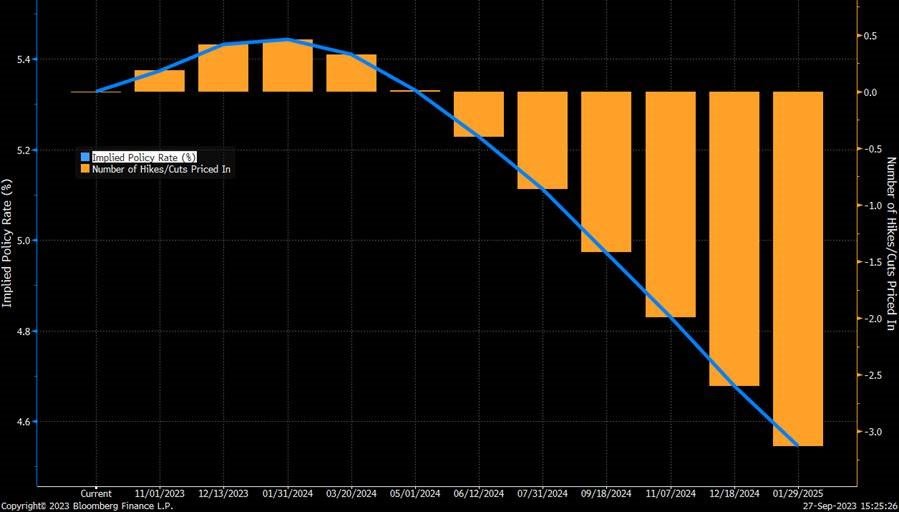
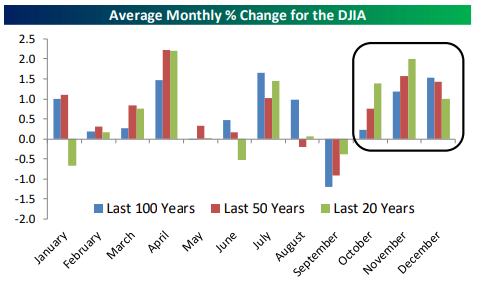
We are now at peak interest rates this cycle and rates are headed down from here. This seems to align favourably for a Q4 rally in equities, consistent with historical seasonality trends. There’s nothing spooky about the recent equity market sell-off. It should not unnerve investors who maintain a thoughtful, medium to long-term investment approach.
“Spooky” equity markets?
Ah, Halloween!
In the 1970s, an experiment sought to determine whether Halloween trick-or-treaters would indulge in taking more candy than allowed, from an unattended bowl.
Predictably, the findings indicated that indeed they did. However, when researchers positioned a mirror next to the candy bowl, children were less inclined to overindulge. Evidently, catching a reflection of themselves heightened their self-awareness, subsequently promoting a greater sense of responsibility and honesty.
So, consider incorporating a mirror into your Halloween decor this year, if you plan to leave an unattended candy bowl at your doorstep.
There’s a valuable message for elders as well: Occasionally, take a moment to reflect on yourself. It will foster greater honesty and responsibility and a reduced inclination to blame others.
Moving on to markets…
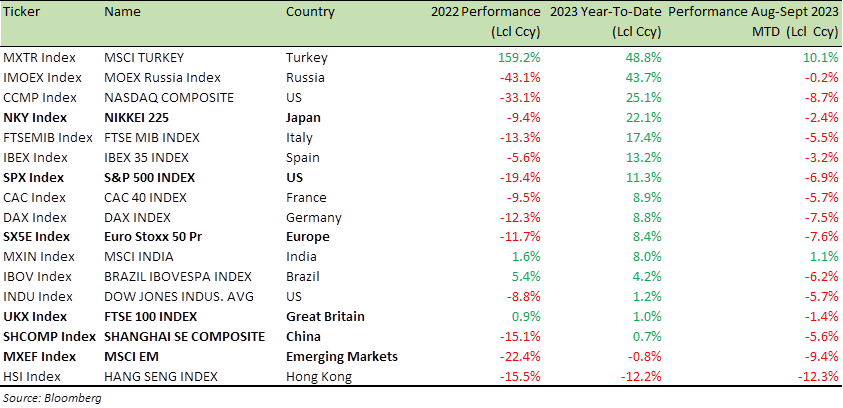
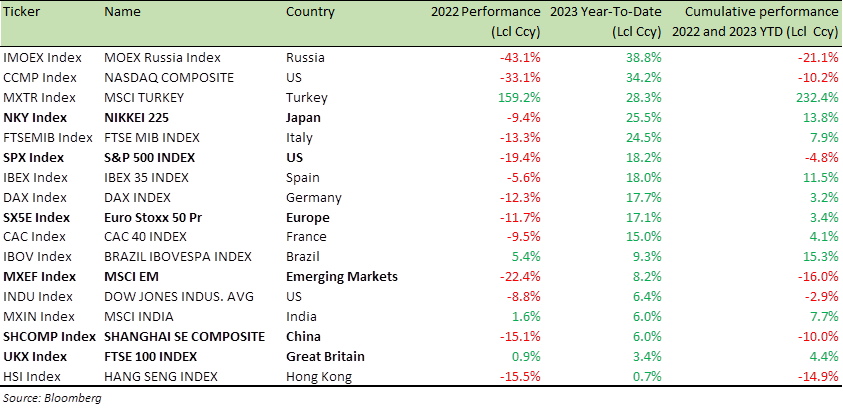
With the NASDAQ down -11% and the S&P 500 (SPX) down -9% over the last 12 weeks (see table below), you could say that stocks are already spooked leading into Halloween.
What’s next – trick or treat?
Let’s look at the individual investor sentiments first.
One of the most dependable indicators, is the American Association of Individual Investors (AAII) survey, which currently reveals a bullish sentiment of 29.3% and a bearish sentiment of 43.2%. This represents the highest reading since the first week of May. Notably, bearish sentiment has surged by 8.6 percentage points in just one week, marking the most substantial weekly increase since February. The bearish sentiment now surpasses the bullish sentiment by a margin of 13.9 percentage points, which is the widest gap seen since May.
Taking a closer look at individual stocks, when comparing the Earnings Yield (the inverse of the Price/Earnings ratio) to their respective 10-year averages, 44 companies within the S&P 100, the largest-cap index, are currently trading with a trailing earnings yield at least 1% higher than their decade-long average.
The energy and automotive sectors top this list, boasting attractive earnings yields, due to either robust recent earnings (in the case of energy) or concerns about future earnings (in the case of autos). Other industries that feature prominently on this list include industrials, telecoms, banks, insurance companies, retailers, and payment firms.
Benchmark Global Equity Index Performance (2022; 2023 YTD and 2023 August-October MTD)
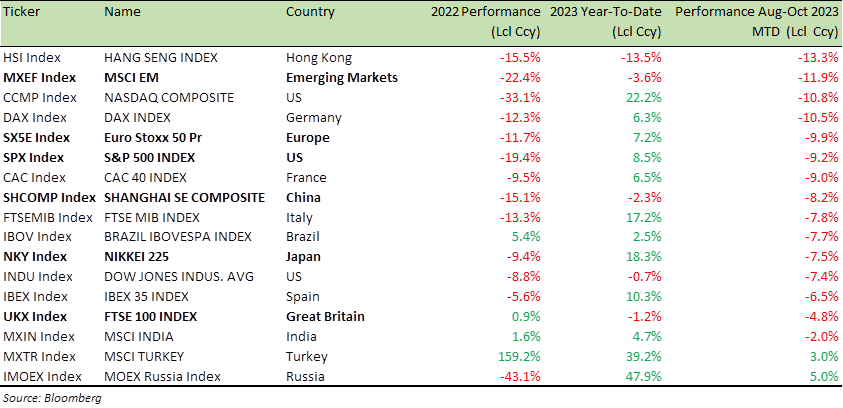
Source: Bloomberg
Regarding the overall US economy, Q3 GDP surged at an annualized rate of +4.9%, surpassing the estimated +4.5%, and representing a notable improvement from the +2.1% in Q2.
Here are some key points to consider:
- Housing and government spending, both essential components of domestic demand, have undergone a remarkable transformation, from being significant headwinds in 2021 and 2022, to becoming substantial tailwinds. Housing activity is on the rise, and government spending on goods and services remains robust. However, the ascent of mortgage rates to nearly +8%, the highest since mid-2000, could potentially dampen housing demand
- The buildup in inventories significantly contributed to the economic expansion in the third quarter, contributing more than 1 percentage point to growth.
- Real income, which accounts for after-tax and inflation-adjusted income for Americans, declined at an annualized rate of -1% in Q3. This is the most substantial quarter-over-quarter drop in real household income growth since Q2 of 2022
The deceleration in real income among Americans may raise some concerns, but on a more optimistic note, the slowing of nominal earnings, while GDP continues to grow, suggests a rapid reversal of inflationary trends.
US GDP data is one set of data points that the US Bureau of Economic Analysis (BEA) produces as part of its quarterly National Income and Product Accounts (NIPA) data release.
Arguably, one of the most noteworthy highlights from last week’s quarterly NIPA release, was the significant decline in core PCE (Personal Consumption Expenditure) inflation.
While the US GDP price index (distinct from the US Consumer Price Index, although both gauge inflation) surged at an annualized rate of +3.5%, compared to +1.7% in Q2 and an expected +2.7%, the US core inflation, as measured by the Personal Consumption Expenditure (PCE) index, is experiencing a sharp downturn in 2023.
The Core PCE increased by +5.0% in Q1, +3.7% in Q2, but then markedly slowed to +2.4% in Q3. This brings it much closer to the +2% target set by the US Federal Reserve (Fed).
Consequently, not only is the Fed likely to keep interest rates steady at its upcoming meeting, but it may also embark on an extended period of unchanged rates. This combination of diminishing price hikes and a resilient economy augurs well for the prospect of a soft-landing scenario, where inflation recedes without triggering a recession, as previously discussed in last month’s Market Viewpoints.
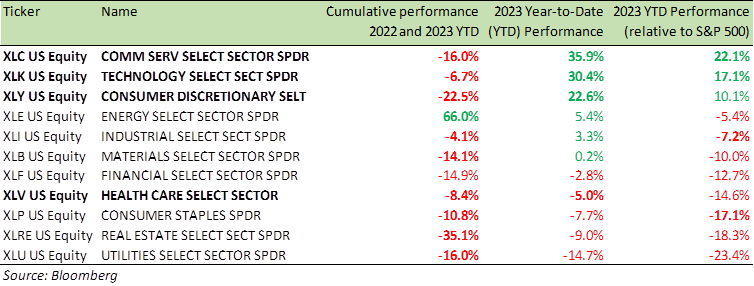
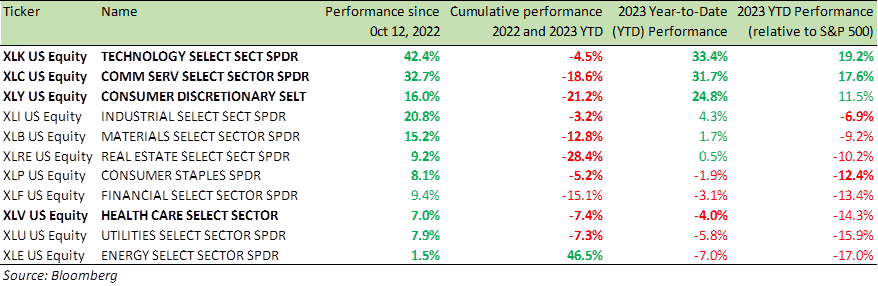
Taking a closer look at specific sectors, despite the SPX’s impressive +8% gain over the past year, most sectors have failed to match the broad market’s performance.
In fact, at present, there are only two sectors (as depicted in the chart below) that have outperformed the SPX in the last twelve months: Communication Services, boasting a remarkable +32% gain, and the Technology sector, which has seen an impressive +29% increase over the past 12 months.
Examining the relative strength lines of each sector below, it becomes evident that these two groups have consistently outshone the broader market since October of the previous year. There exists a substantial gap between their relative performance and that of other sectors.

Source: Bespoke Invest
Technology (XLK) and Communication Services (XLC) have significantly bolstered the SPX, while most other stocks have struggled amid rising interest rates. However, in the past 12 weeks, both XLK and XLC have experienced -10% to -12% decline, which has, in turn, weighed down the SPX. This sell-off is primarily driven by the downturn in the Technology and Communication Services sectors, even though they have consistently been the top performers.
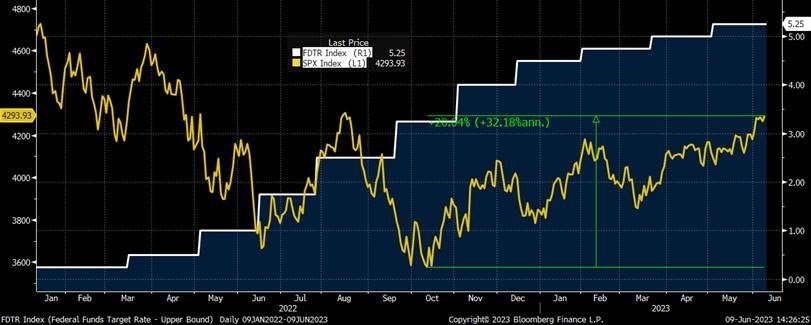
Now, we find ourselves at the peak of interest rates, which offers ample cause for optimism, given that rates are headed lower from here.
More than a decade ago, Marc Andreessen, the co-founder of the venture capital firm Andreessen Horowitz, famously declared that “software is eating the world.” This assertion holds truer today than ever before.
Below is data from a report by the Philadelphia Federal Reserve which lists out capital expenditure plans for this year, and compares it to the change from last year.
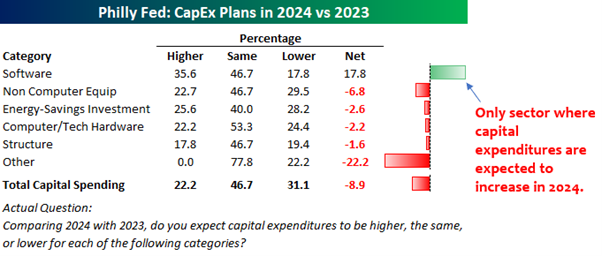
Software continues to experience an upswing in capital expenditure allocation within corporate
budgets, overshadowing investment in almost every other sector. Not even the category of Energy-Savings Investments, which had recently captured the attention of most C-suite executives aiming to enhance their ESG (Environmental, Social, Governance) credentials, has been exempt from this trend.
Tech and software stocks still hold great promise.
So, overall, there’s nothing spooky about the recent sell-off. It should not unnerve investors who maintain a thoughtful, medium to long-term investment approach. However, traders who engage in short-term trading and utilize leverage should remain attentive to market volatility, particularly if concerns about a recession intensify.
Think of this sell-off as a momentary startle, akin to a “one-day ‘Boo!’” or “a bump in the night.” Embrace it as an opportunity to initiate long trades and, if feasible, structure these trades to generate returns through structured equity strategies, a view I consistently emphasize each month in these pages.
Rest assured, there will be no Halloween-themed puns in the following section.
Markets and the Economy
The seven technology stocks – Apple, Google, Facebook, Microsoft, Amazon, Tesla, and NVIDIA, have been responsible for all the year-to-date (YTD) gains in the MSCI’s All-Country World Index (ACWI), which encompasses nearly 3,000 large and mid-sized companies. The seven stocks have been dubbed the “Magnificent Seven.”
Those of a certain vintage (and Western film fanatics) will remember the classic 1960 film The Magnificent Seven. This cinematic masterpiece, features an ensemble cast of acting icons, including Yul Brynner, Steve McQueen, Charles Bronson, and James Coburn, among other distinguished stars.
In the movie, “The Seven” gunslingers lead by Brynner (as Chris Adams) come to the rescue of a besieged village under assault from bandits. The “Magnificent Seven” tech stocks have come to rescue the stock market. Without the contributions of these seven stocks, the ACWI index would have experienced a decline YTD. Together, they have added a cumulative 40 points to the index, which has seen an overall increase of 37 points.
The SPX is currently trading at approximately18 times projected earnings for the next 12 months, in contrast to the MSCI All-Country (excluding US) stocks, which are trading at about 12 times earnings.
It’s worth noting that US stocks are not overvalued; it’s the stocks from the rest of the world that are attractively priced. Geopolitical uncertainties bear down on the valuation of non-US stocks. Historically, geopolitical concerns have had a more pronounced impact on markets outside the US.
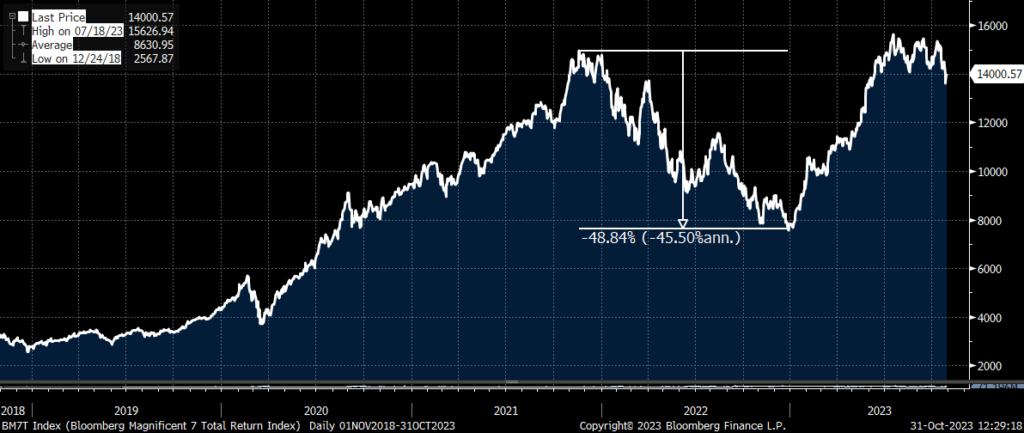
It’s important to highlight that the “Magnificent Seven” experienced a -48% decline (as depicted in the chart below) during the 2021-22 tech sell-off, coinciding with the onset of interest rate hikes. However, it is a testament to their resilience that these stocks have not only recouped all their losses in just under 18 months but have done so during a period of rising interest rates.
The Bloomberg “Magnificent Seven” Total Return Index – 5-year price chart
Source: Bloomberg
Five of the “Magnificent seven” stocks – Amazon, Microsoft, Meta, Alphabet, and Tesla – have already reported their third-quarter earnings. Apple is scheduled to release its report on Thursday, and Nvidia’s earnings are expected on November 21.
Robust recovery in online advertising expenditures, sustained expansion in the cloud-computing sector, effective cost management, and controlled hiring practices have collectively contributed to an impressive earnings performance for these leading tech giants.
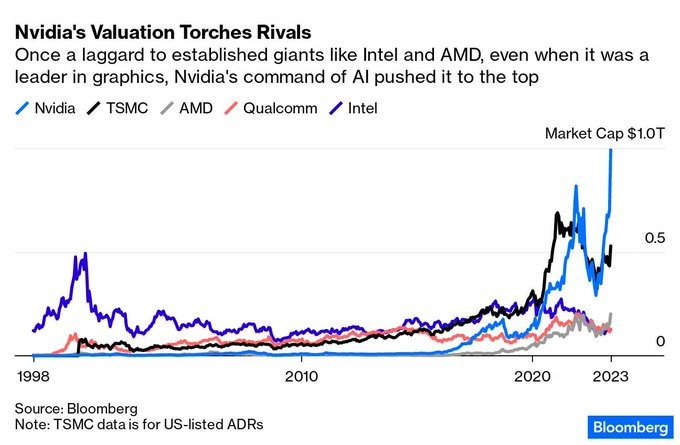
However, the big tech stocks are down approximately -15% from their recent peaks, with Tesla experiencing a substantial -30% decrease. Notably, the Q3 earnings reports from major tech companies have consistently underscored substantial investments in Artificial Intelligence (AI), a trend that could favourably impact Nvidia.
Moving on to Europe
In another indication that we have reached the peak in interest rates, the European Central Bank (ECB) opted to keep rates unchanged during its recent meeting.
The ECB presented a rather unremarkable policy statement, stating that “incoming information broadly confirmed the previous assessment” of the economy and inflation.
The ECB Governing Council emphasized the need to maintain the current rate level “for a sufficiently long period.” It pointed out that rate increases have been “increasingly dampening demand,” and most underlying inflation measures have continued to trend downward.
ECB President Christine Lagarde noted that the European economy “remains weak” with “some signs of labour market weakening.” Although the economy is expected to strengthen in the coming years, she mentioned that “credit dynamics have weakened further.” ECB’s stance is to remain steady and hold the current rates. Rate cuts were not discussed. In general, they believe that “now is not the time for forward guidance.”
While the ECB, much like the Fed, cannot explicitly declare that it has reached its terminal rate, it appears highly unlikely that further rate hikes will be implemented, as the delayed impacts of tightening policies are expected to unfold “through Q4 2023 and Q1 2024.”
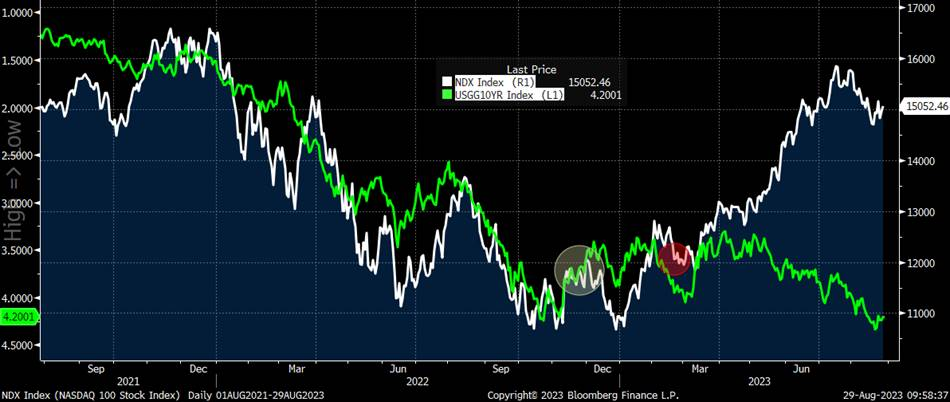
Here’s an intriguing data point to consider: the correlation between stocks and bonds.
After an extended period during which stock and bond prices moved in opposite directions, we are now witnessing a notable uptick in the correlation between these two asset classes.
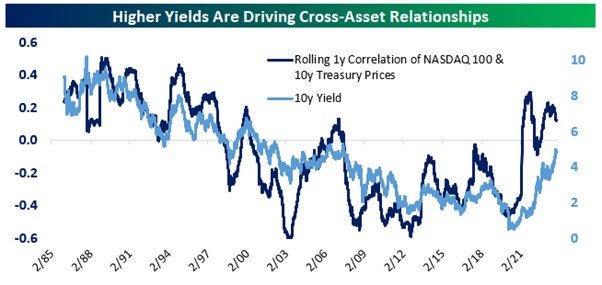
Source: Bespoke Invest
In the chart above, provided by our research partner, Bespoke Invest, we observe the historical correlation between daily fluctuations in the NASDAQ 100 and 10-year Treasury prices. The data reveals that this correlation steadily declined from the 1980s through the 2010s but has recently seen a resurgence.
In essence, around 35 years ago, stocks and bonds typically moved in tandem. However, this pattern reversed over the course of the 2010s, when they consistently exhibited opposing movements. In the past few years, this trend has reverted once more, with bond and stock prices now exhibiting a synchronized movement, marking a complete turnaround from the behaviour observed over the past two decades.
What adds an intriguing dimension to this observation is that this same pattern of stock-bond correlations diminishing and subsequently reversing, can also be applied to interest rates. In other words, in a high-rate environment (bond yields as proxy), stocks and bonds exhibit a positive correlation, whereas in a low-rate environment, this correlation tends to dissipate.
One possible explanation for this phenomenon could be inflation.
Low interest rates (good for stocks) typically coincide with periods of low inflation. However, when inflation starts to climb, it necessitates central banks to respond not only to economic growth and employment, but also to inflation itself. This dynamic creates the potential for periods of sluggish economic growth and the implementation of restrictive monetary policies (bad both for stocks and bonds), which are less feasible during low inflation periods. This upswing in rates may explain the growing correlation between bond and stock prices.
They also seem to reflect the reality that central banks are as much of a risk to economic activity and risk assets, as they are a support when inflation concerns were not a prominent issue.
A trade in small-cap stocks is becoming increasingly attractive, especially as interest rates begin to trend lower.
Throughout this year, the gap in performance between small-cap stocks and large-cap stocks has continued to widen. The small-cap Russell 2000 index is currently down over -33% from its post-Covid highs. In contrast, large-cap stocks have displayed more resilience, with the SPX declining by less than -14% from its post-Covid high. Consequently, this divergence has resulted in the large-cap SPX outperforming the small-cap S&P 600 by more than 15 percentage points in 2023.
The performance gap between the two indices is notable across most sectors, as illustrated in the chart below. It provides a year-to-date comparison of the performance of large-cap (SPX) and small-cap (S&P 600) sectors, thus far this year.

Source: Bespoke Invest
As previously mentioned, there is no need for undue apprehension and stock valuations are not excessively high, nor is market sentiment overly bullish.
Taking a broader perspective, many stocks are not overvalued, and a significant portion of them have experienced no growth over the past 12-24 months, due to the notable rise in interest rates.
All these factors seem to align favourably for a potential Q4 rally, consistent with historical seasonality trends, as discussed in our September Market Viewpoints
Benchmark US equity sector performance (2022, 2023 YTD and 2023 YTD relative to the S&P 500 Index)

In the table above, you can observe the sector-level performance of the SPX. On a 24-month basis (the first column), with the exception of the energy sector, all other sectors are displaying negative returns.
The cycle of rising interest rates appears to have concluded, and the prospect of rate cuts in the near future, is on the horizon. This transition may introduce a period of increased volatility as market participants begin to factor in the potential for a recession.
Therefore, I emphasize the value of equity structured products as a highly effective way to invest in equities, serving as a means to navigate and potentially benefit from heightened market volatility. These products provide a certain level of capital protection, all the while aiding in the identification of favourable entry points in the market and offering opportunities to generate returns, even in a flat or negative market environment.
For specific stock recommendations and insights related to structured products, please don’t hesitate to reach out to me or your dedicated relationship manager.
Best wishes,

Manish Singh, CFA