The S&P 500 index is now in a bull run and investors have also turned bullish. Can equtiy markets go even higher from their current levels? Crossbridge Capital CIO, Manish Singh, CFA shares his views in this month’s MVP…
Summary
The S&P 500 index is now in a “bull run.” With the onset of a new bull market now confirmed, investors have also turned bullish.
The most recent sentiment data released by the American Association of Individual Investors (AAII), indicates a significant surge in optimism. In contrast to the average of approximately 25% of respondents reporting as bullish over the past year and a half, this week, saw a remarkable increase, with 44.5% reporting as bullish.
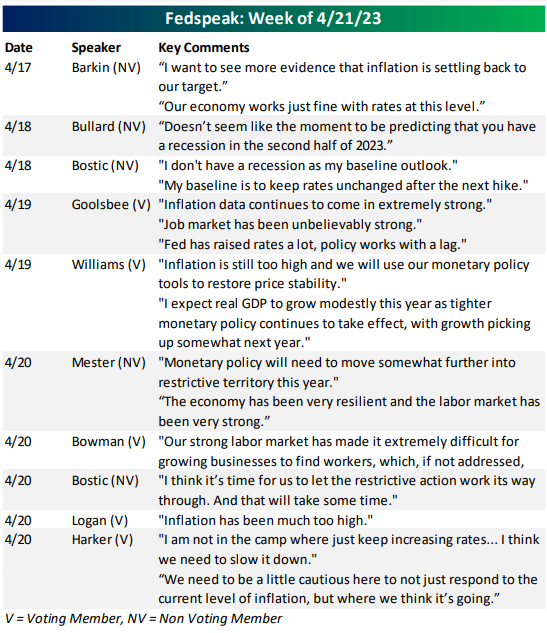
Meanwhile, the US Federal Reserve is considering a slowdown in its pace of interest rate hikes, as evidenced by their plan to skip an increase this month. This decision aligns with the latest US ISM Services data released last week, which indicated that the sector is on the verge of a contraction.
Nvidia surprised the market two weeks ago by announcing its sales projection of $11 billion for the three-month period ending in July. This figure surpasses the previous estimate by more than 50%. Such substantial revenue surprises are rarely witnessed among mega-cap companies. Its stock has since surged.
It appears highly likely that we are witnessing the dawn of a significant new AI-driven technological era, comparable to the advent of the PC, the internet, mobile devices, and cloud computing.
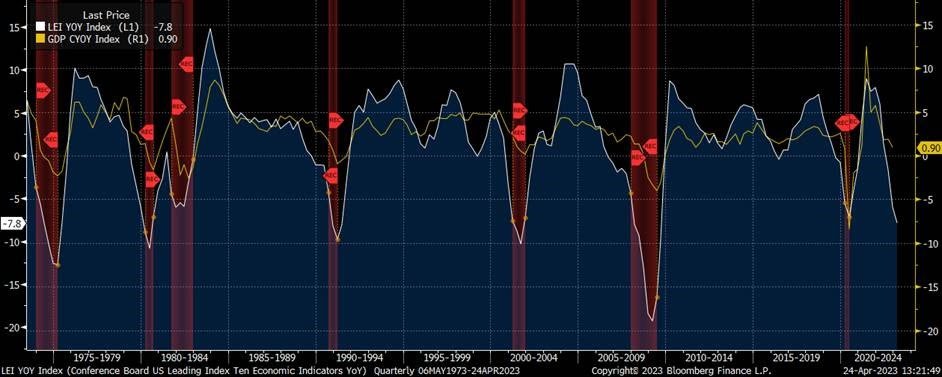
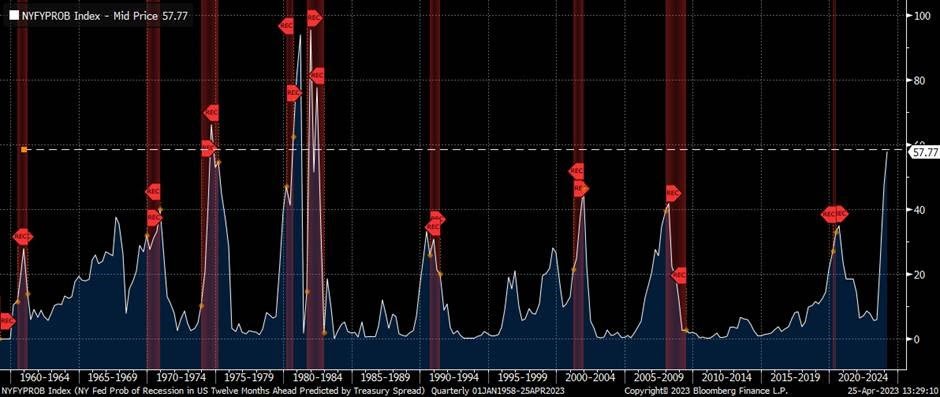
The looming risk of a US recession continues to hang over equity markets, akin to the sword of Damocles. However, the surge in construction spending on manufacturing projects and the low unemployment rate in the US, could propel equities even higher from their current levels.
S&P 500 Index in a “Bull Market”; US Federal Reserve set to pause
As summer approaches and the allure of a vacation beckons, let us take a moment to examine the market, before basking in the sun. Fortunately, there is plenty of positive news to share.
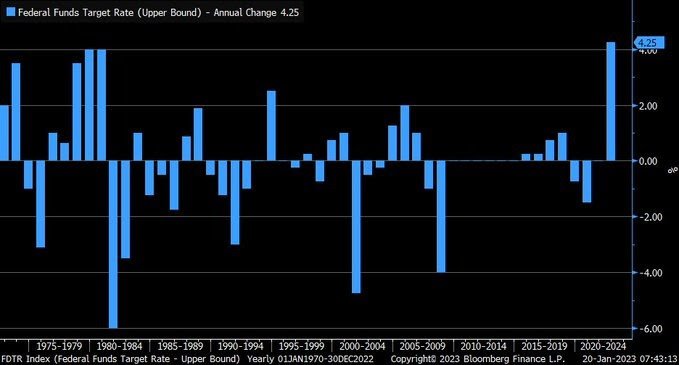
Cast your mind back to March 16, 2022, when Jerome Powell, the Chair of the US Federal Reserve (Fed), initiated a tightening cycle by raising interest rates, which has resulted in the fastest pace of tightening in over four decades.
Despite concerns that this tightening would harm the stock market, as of yesterday’s closing, the S&P 500 index (SPX) has experienced a total return increase of +0.22% since that date. It seems that the fears that a Fed tightening would crush the stock market, have been proven wrong.
I consistently emphasize in my newsletters, the importance of patience and long-term thinking when it comes to investing. Market fluctuations are to be expected, and it is crucial to stay the course. The wise American investor, Shelby Davis, captured this sentiment perfectly when he said: “History provides a crucial insight regarding market crises: They are inevitable, painful, and ultimately surmountable.”
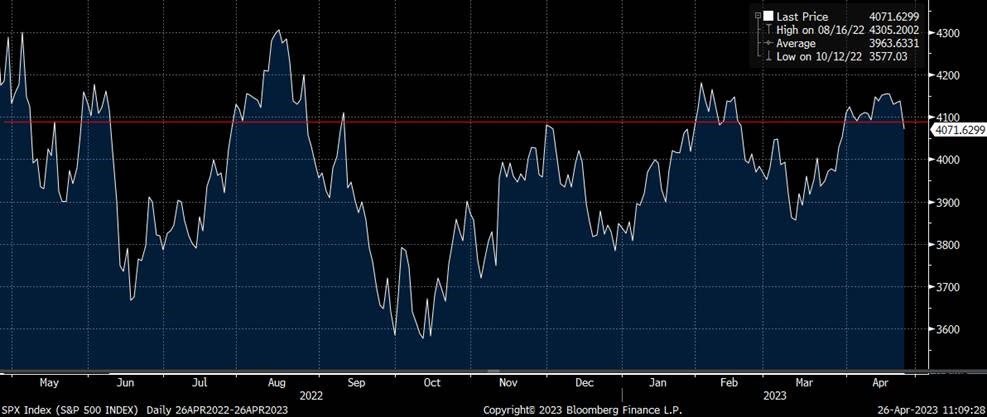
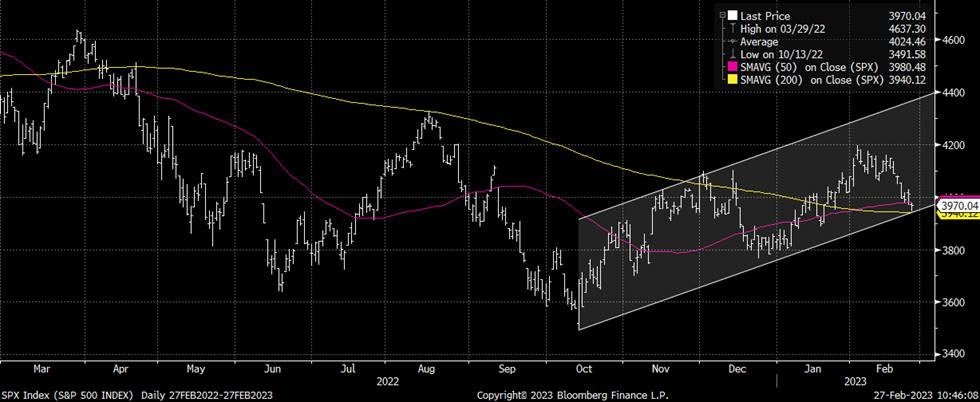
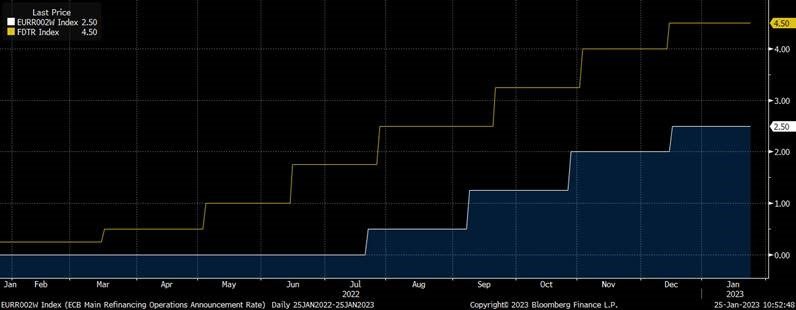
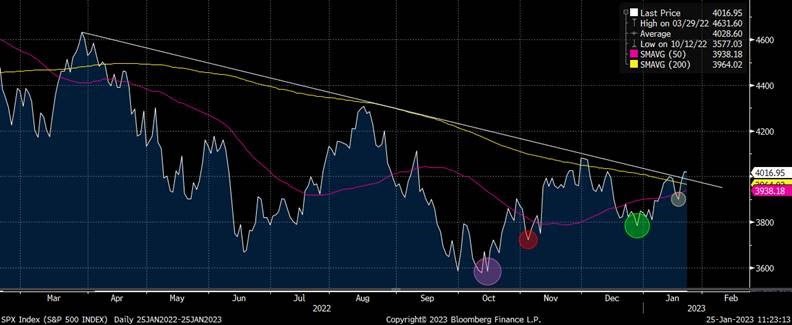
Looking at the price chart of the SPX and the Fed Funds Target Rate (FDTR) over the past 18 months, we can observe the market’s resilience.
S&P 500 index (SPX) and Fed Funds Target Rate (FDTR): 18-month price chart
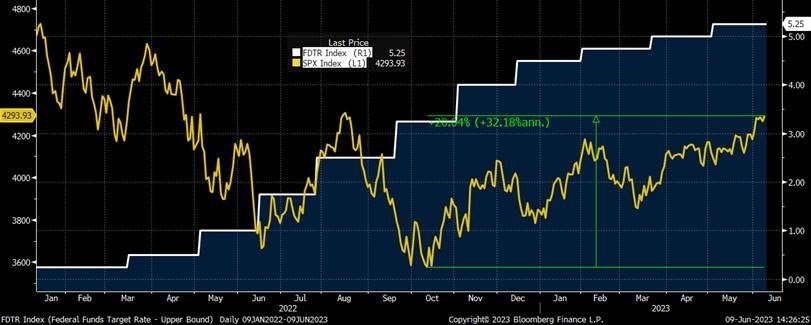
Source: Bloomberg
Remember the turmoil surrounding the failure of Silicon Valley Bank (SVB) on March 10, or the recent concerns about the US debt ceiling? Despite these events, the SPX has risen over +11% since March 10.
The SPX is in a “bull run,” defined as a rally of over +20%, following a decline of -20%. Since reaching its lowest point on October 12, 2022, the SPX has now risen by +20.2%.
Within less than a year and a half, we have witnessed the SPX bouncing back. If you are not engaged in short-term trading or leveraged strategies, you have less to worry about and less to lose. As a rule: Always establish a solid investment strategy and resist the temptation to make emotional decisions driven by market noise. Discipline is key to avoiding unintended failures.
Meanwhile, the Fed is considering a slowdown in its pace of interest rate hikes, as evidenced by their plan to skip a hike this month. This decision aligns with the latest ISM Services data released last week, which indicated that the sector is on the verge of a contraction.
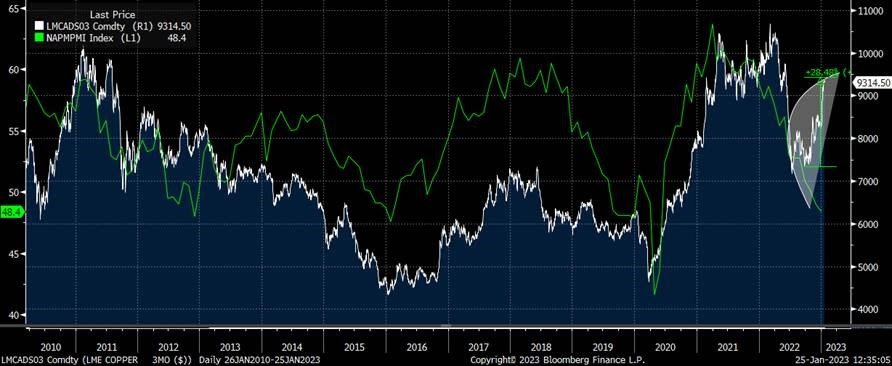
The ISM Services index declined to 50.3 (yellow line in chart below), indicating it is barely in expansionary territory (a reading below 50 signals a contraction). Components such as new orders, prices paid, and employment, all experienced drops, with employment reaching 49.2, signifying a contraction in the job market.
5-year price chart: US ISM Manufacturing PMI and ISM Services PMI
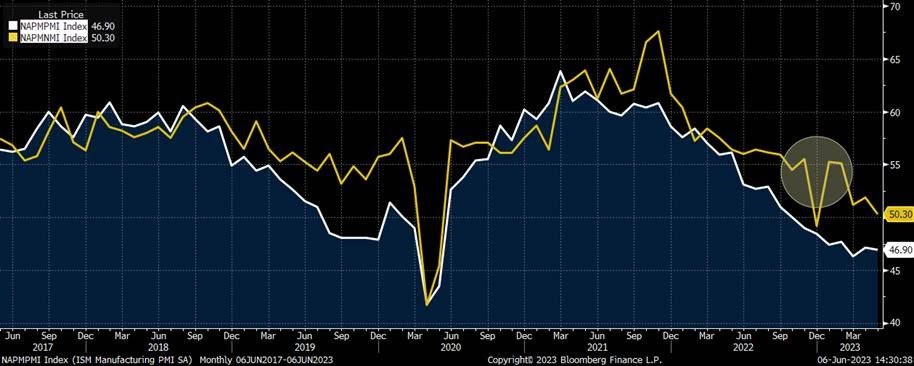
Source: Bloomberg
Over the past months, while the ISM manufacturing data slipped into contraction, the ISM Services data remained relatively stable, bolstering the Fed’s confidence in raising rates.
However, with the ISM Services index at 50.3, it is highly unlikely that the Fed will maintain the same stance.
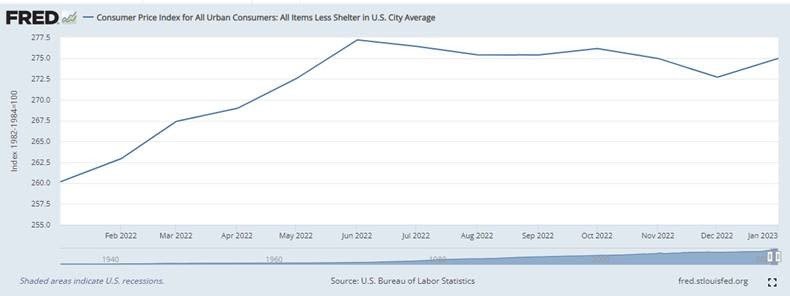
The recent ISM Services data strongly suggests a “Fed pause.” Additionally, when we consider the average prices paid component of both the ISM Manufacturing and ISM Services, the prices paid index has returned to pre-COVID levels (see chart below). It disproves the narrative that the US economy is expanding rapidly and needs rates to stay high, let alone take in more rate hikes as some have even suggested.
5-year price chart: ISM Manufacturing and Services prices paid index and US inflation

Source: Bloomberg
The decline in ISM prices paid aligns with the significant drop in wage growth reported in the recent jobs report. Month-on-month US wage growth has cooled to +0.3% (down from highs of +0.6%)
Wages are by far the biggest expense for services firms, and the Fed has made it clear they want to see slower wage gains bear down on core inflation, ex-rent.
Therefore, the Fed will be comfortable to “pause” and not raise rates when they next meet June 13-14.
Markets and the Economy
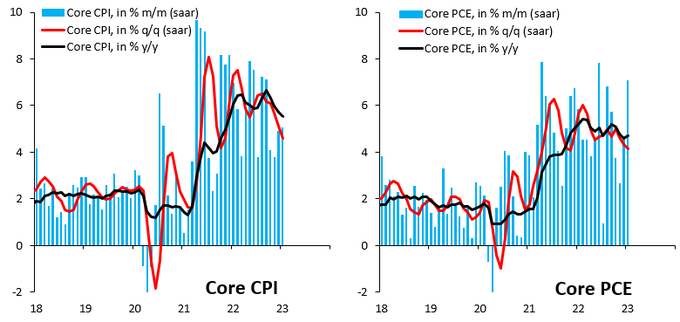
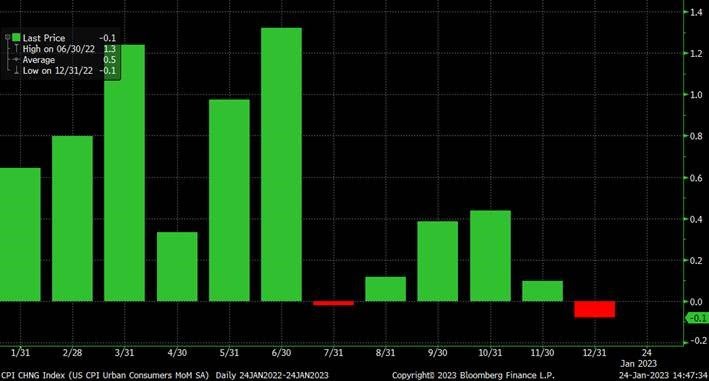
The markets are evidently factoring in a return to an inflation rate of +2% to +3% in the US, with the expectation that other major economies will follow suit, in due course. This anticipated inflationary trend, is likely to materialize before the end of the year in the US.
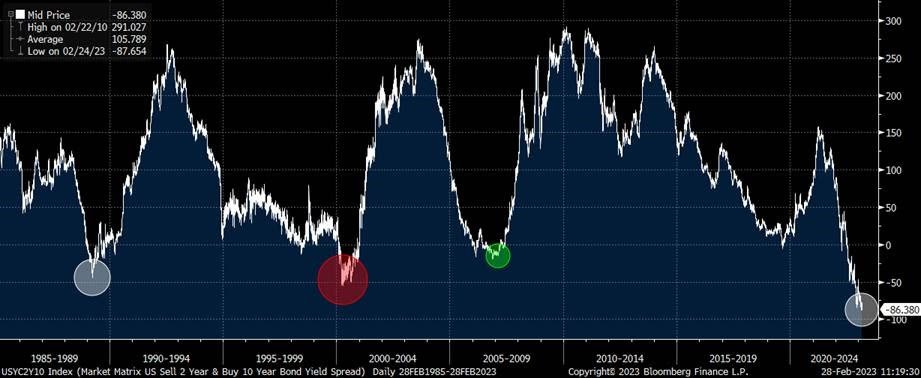
One compelling indicator of the market’s confidence in managing inflation, is the trading behaviour of the 10-year US Treasury.
Despite headline inflation reaching +6%, the 10-year Treasury has remained relatively stable within a tight range of +3.5% to +3.7% over the past six months. Additionally, the downward slope of the yield curve, further supports the notion that concerns about inflation have diminished.
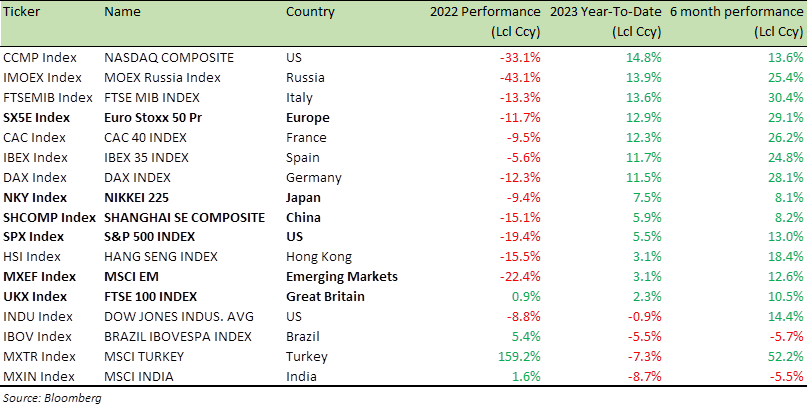
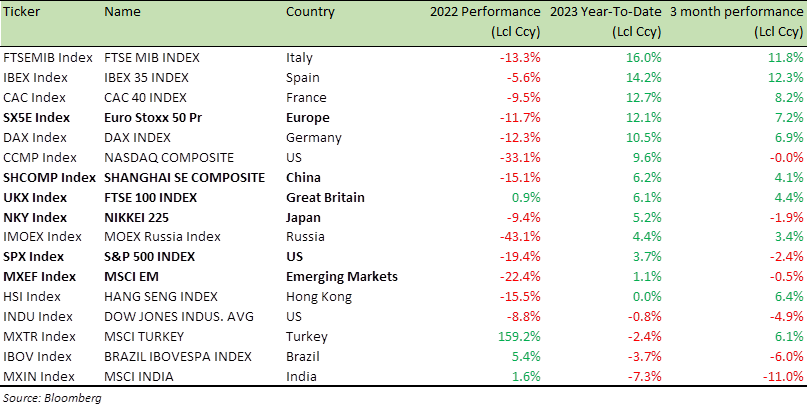
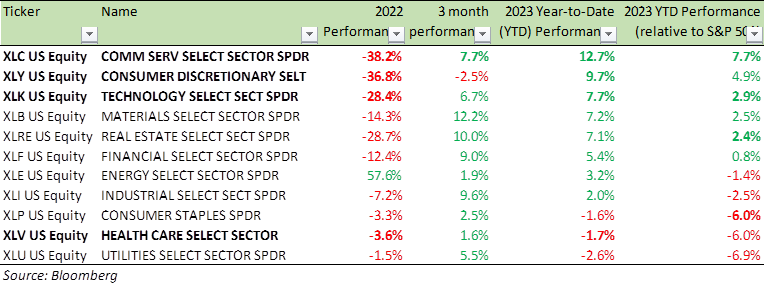
Consequently, the performance of equities (as illustrated in the table below), aligns with this perspective. While the potential for a recession in the US remains a challenge, the low employment rate acts as a mitigating factor, preventing it from gaining significant traction.
Benchmark Global Equity Index Performance (2022; 2023 YTD)

Another factor that could potentially help the US avoid a recession this year, is the significant construction spending on manufacturing projects.
The latest data on US Construction Spending for April shows a robust increase of +1.2% (compared to the estimated +0.2% and the previous +0.3%). Notably, spending on construction for manufacturing projects (represented by the yellow line in the chart below) remains strong, compensating for declines in residential building (represented by the green line).
The resilience of the manufacturing sector’s construction spending is particularly encouraging, because it is typically among the first to suffer declines in spending and job losses, when interest rates rise. This unexpected strength has been a pleasant surprise, contributing to job creation and supporting GDP growth.
The Infrastructure Investment and Jobs Bill enacted in 2021, along with last year’s climate, tax, and healthcare legislation, all are injecting substantial funds into industrial projects. These include the expansion of manufacturing facilities, renewable energy initiatives, and railroad expansions. Such investments promise to keep workers engaged for years to come. Additionally, the computer/electronic manufacturing sector is experiencing a renaissance in the US, thanks to the $53 billion CHIPS and Science Act, which offers direct financial assistance for the construction and expansion of manufacturing facilities.
This program has already sparked an investment boom, with both domestic and foreign manufacturers announcing over 40 projects, totalling investments close to $200 billion, according to the Semiconductor Industry Association. Industry giants like Intel, TSMC, Samsung Electronics, Micron Technology, and Texas Instruments, have unveiled substantial investment plans, totalling billions of dollars.
It would be prudent for the Fed to avoid hindering this growth, by maintaining high interest rates for an extended period or even by further increasing them.
Census Bureau US construction spending (Manufacturing and Residential): 20-year price chart
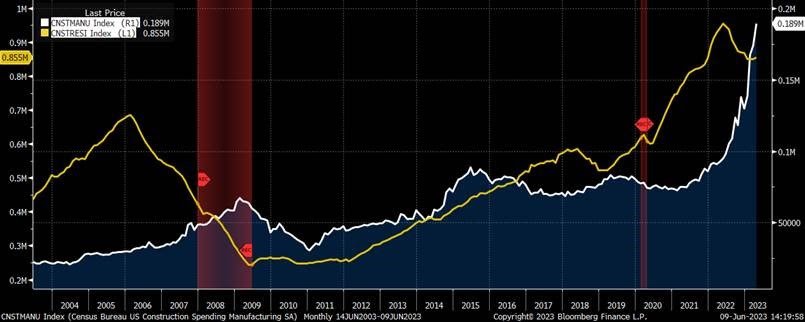
Source: Bloomberg, Census Bureau
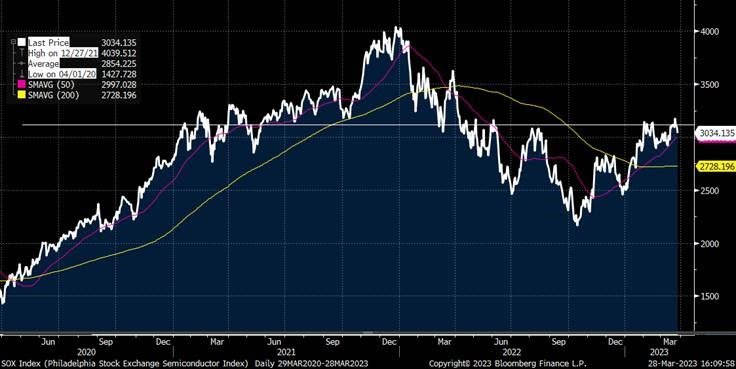
In my March Newsletter, I wrote: “Semiconductor stocks, long seen as a cyclical play, may be turning into a secular growth story, particularly if the AI-driven revolution stacks up well over the next few years. One to watch.”
Recent events have swiftly validated this prediction.
The rally in semiconductor stocks has been remarkable since then. The Philadelphia Stock Exchange Semiconductor Index (SOX) has surged over +20%, while the share price of US chipmaker Nvidia (NVDA) has skyrocketed by more than +70%.
Nvidia surprised the market two weeks ago by announcing its sales projection of $11 billion for the three-month period ending in July. This figure surpasses the previous estimate by more than 50%. Such substantial revenue surprises are rarely witnessed among mega-cap companies.
It appears highly likely that we are witnessing the dawn of a significant AI-driven technological era, comparable to the advent of the PC, the internet, mobile devices, and cloud computing.
Just two days following the ground-breaking quarterly earnings announcement, Jensen Huang, the CEO of Nvidia, delivered an inspiring commencement speech at Taiwan’s prestigious National Taiwan University. During his address, Huang shared valuable insights on entrepreneurship, humility, and perseverance. The entire speech is highly recommended, and you can watch it in its entirety at this link
Allow me to highlight one principal section from his speech, (which dates back to 2010, when the mobile phone industry was maturing) that particularly resonated with me:
Huang said:
“The phone market is vast. We could have competed for market share. However, we made a difficult decision and chose not to pursue that market. Nvidia’s mission is to construct computers capable of solving problems that ordinary computers cannot. We should dedicate ourselves to realizing our vision and making a unique contribution.
Our strategic retreat turned out to be a wise move. By leaving the phone market, we opened our minds to creating a new one. We envisioned developing a new type of computer for robotics, equipped with neural network processors and safety architectures capable of running AI algorithms.
At that time, this market was worth zero billion dollars. By withdrawing from the massive phone market and venturing into the zero-billion-dollar robotics market, we now have a thriving automotive and robotics business worth billions of dollars, essentially pioneering a new industry.
Retreat is not an easy choice for the brightest and most successful individuals, such as yourself. However, strategic retreat, sacrifice, and determining what to give up lie at the very core of success.”
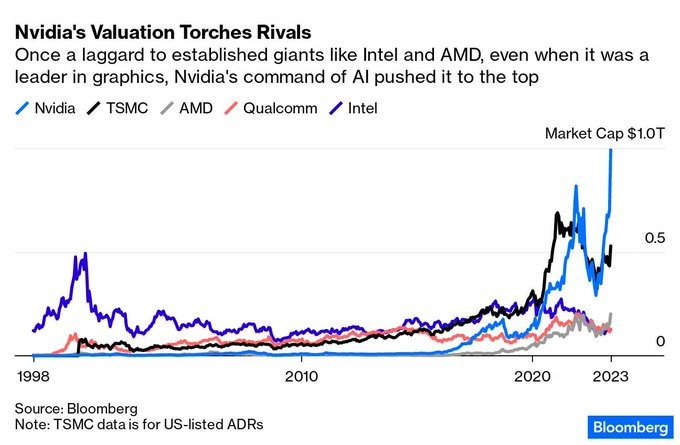
Nvidia has played a pioneering role in the development of Graphics Processing Unit (GPU) technology, which has become essential in the realms of gaming and digital production. In order to maintain a strong focus on advancing GPU chips, Nvidia made the strategic decision to sacrifice market share in other areas of the semiconductor chip industry. The chart below vividly demonstrates Huang’s visionary leadership at Nvidia, highlighting the lack of similar leadership at rival Intel.
The advent of AI is set to generate entirely new job opportunities that never existed before. Roles such as data engineering, prompt engineering, AI factory operations, and AI safety engineers are emerging as a result. Automated tasks may render certain jobs obsolete, but AI will undoubtedly transform every profession, empowering programmers, designers, artists, marketers, and manufacturing planners to enhance their performance significantly. The prospects are incredibly exciting, I must admit.
As we navigate the AI age, I firmly believe that Huang’s speech will eventually be regarded on par with Steve Jobs’ iconic 2005 Stanford commencement address. Given Nvidia’s visionary CEO and its continued involvement in shaping the AI future, the company remains a solid investment despite its lofty valuations. Huang’s propensity for making bold bets, further adds to the allure.
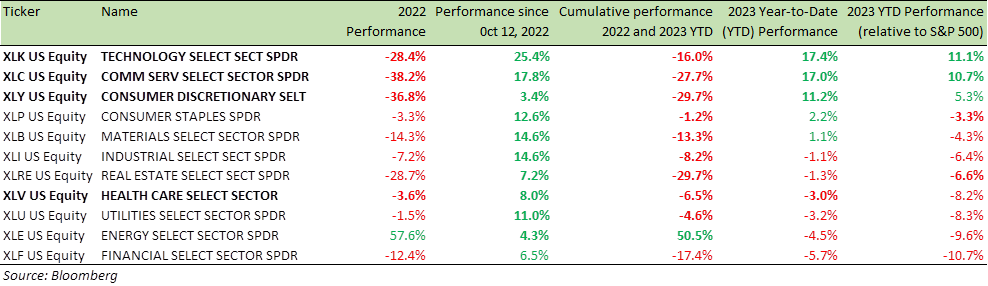
Benchmark US equity sector performance (since Oct 12, 2022; 2023 YTD and 2023 YTD relative to S&P 500 Index)
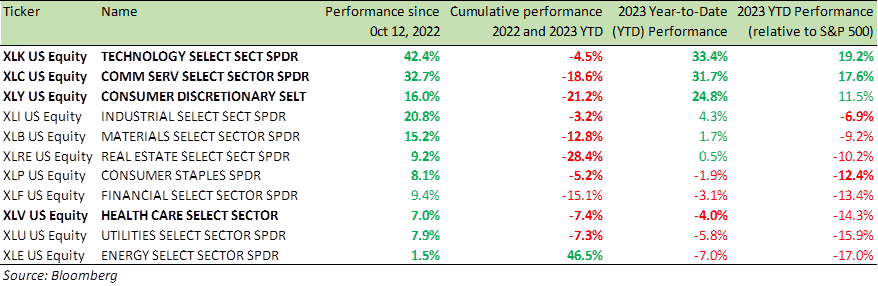
Technology and Communication sector stocks have experienced a notable upward trend, as indicated in the table above.
With the interest rate cycle approaching its peak, it is expected that growth stocks will reap greater benefits as rates begin to decline but the looming risk of a US recession continues to hang over the market, akin to the sword of Damocles.
However, as mentioned earlier, the flourishing manufacturing sector and low unemployment rate could propel US equities even higher from their current levels.
Instead of waiting for a market correction to adopt a long position, which has proven unfavourable for equity bears for the past nine months, it is advisable to utilize structured products for investment purposes. Structured products offer the opportunity to implement such a view while providing a degree of capital protection. They also facilitate the identification of favourable entry points in the market and offer avenues to earn coupons, even in a flat or negative market environment.
I consistently emphasize the usefulness of structured products for equity investments. They present a valuable combination of capital preservation and strategic market entry.
For specific stock recommendations and ideas related to structured products, please feel free to reach out to me or your relationship manager.
Best wishes,

Manish Singh, CFA