


US Economic data continues to disappoint. Fed officials are increasingly looking out of touch, as they raise rates focusing largely on lagging indicators instead of focusing on the leading indicators.
Summary
US Economic data continues to disappoint. Leading indicators are flashing red and there are clear signs that the US economy is on the verge of a recession (if not in one already), whilst over the past nine months, US inflation is annualising at +3.2%, down nearly two-thirds from its highs of +9.1% in June of last year
It’s hard to imagine how anyone could, credibly, make the argument that the US economy can endure more interest rate increases. Well, there are some, and crucially (or unfortunately), they’re all on the Federal Reserve Open Market Committee (FOMC). The FOMC is set to raise interest rates by +0.25% at its meeting next week, taking the Federal Funds Target Rate (FDTR) to a range of +5.0% to +5.25%. That’s a cumulative increase of 5% over 14 months, the fastest pace of tightening since the 1980s.
Fed officials are increasingly looking out of touch, as they continue to act and sound hawkish, focusing largely on lagging indicators instead of focusing on the leading indicators. When reality hits, rate cuts will inevitably follow.
May is upon us and the “Sell in May and go away” commentary – weaker returns during May to October compared to the period from November to April – has started to pour in. However, like every other market maxim, “Sell in May” is not a hard and fast rule, and the reality is more nuanced.
In the first full quarter free of its Covid restrictions, China’s GDP grew by +4.5% in Q1. Given the size and importance of the Chinese economy, the growth marked a bright spot for a global economy facing various headwinds. Very encouragingly, the growth was driven in large part by retail sales, which jumped more than +10% in March from a year earlier. If this trend were to continue, we could easily see China’s Q2 GDP growing by of over +6%. This would please the global economic sentiment no end.
“Fool in the Shower“ moment
Over the past nine months, the headline US Consumer Price Index (CPI) is annualising at the rate of +3.2%, this is down nearly two thirds from its highs of +9.1%, in June of last year.
US Economic data continues to disappoint, and there are signs that the US economy is on the verge of a recession (if not in one already):
- The US Conference Board leading Economic Index (LEI) is now contracting at -7.8% p.a. (see chart below). During recessions in the early 1970s and early 1980s, the annual decline was never this negative.
- The Philadelphia Fed Manufacturing Index, released last week, came in significantly weaker than expected, falling to -31.3 versus an already pessimistic forecast of -19.3. April’s report was also the 8th straight month, where the general business outlook was negative and there has never been another streak of eight or more months that didn’t occur during a recession
- In the last eight recessions going back to 1970, in the twelve months leading up to the recession, the US initial jobless claims rose by an average of 52,000 (or +20%) from their lowest point in that period up to the start of a recession. Following the revisions earlier this year, the US initial jobless claims have now risen by 65,000 from their low of 182,000 in September 2022 i.e. a +36% change
- While economists were forecasting a decline of -0.5% for March US Retail sales, the actual decline was much larger at -1.0%
- The prices paid component within the Dallas Fed Manufacturing Index continued to tick lower in April, now down to 19.4, its lowest since July 2020. Price pressures have faded quickly, considering the index was at 60.3 one year ago
- In growing signs of slowdown, the US GDP grew at the rate of +1.1% p.a. in Q1, down from +2.6% in Q4 2022, and lower than the +1.9% expected
US Leading Economic Index (white) and US Real GDP growth (orange)
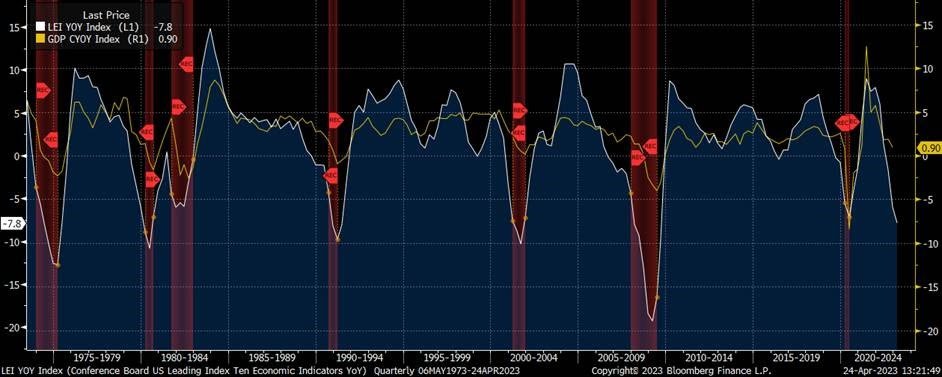
Source: Bloomberg
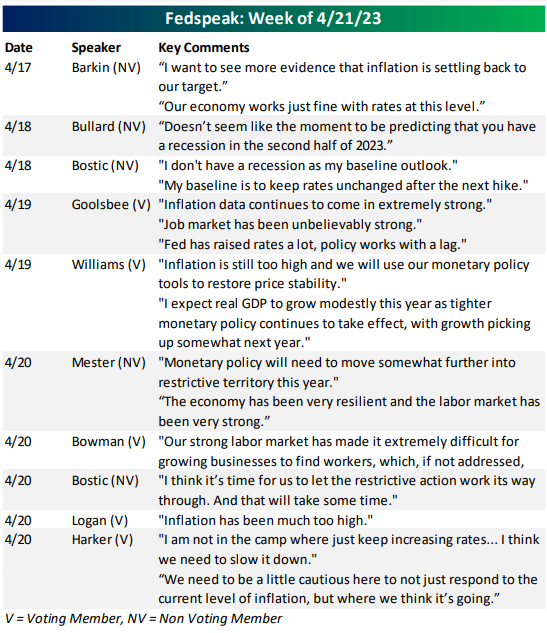
Last week, there was a flurry of US Federal Reserve (Fed) commentary (see summary below from Bespoke Invest, our research providers), updating us on the thinking of the Federal Open Market Committee (FOMC).
It’s hard to imagine how anyone could credibly make the argument that the US economy is “resilient” and can take more interest rate hikes. Well, there are some, and crucially (or unfortunately), they’re all on the Federal Reserve board.
Only Philadelphia Fed President Patrick Harker sounded the most realistic – “we need to slow it [rate hike] down.. we need not just respond to the current level of inflation, but where we think it’s going,” and that is down to the ugly manufacturing sector report in his Philadelphia district that was released earlier that day.
The FOMC remains set to raise interest rates by +0.25% at their May 2-3 meeting next week. This will bring the Federal Funds Target Rate (FDTR) to a range of +5.0% to +5.25%. That’s a cumulative increase of 5% over 14 months, the fastest pace of tightening since the 1980s (and nearly twice as fast as the rate hike cycle of 1988-89).
In my opinion, the FOMC is at risk of behaving like the “Fool in the Shower” in Milton Friedman’s metaphor – where Friedman likened a central bank that acted too forcefully to a fool in the shower who finds the water too cold. The fool turns up the hot water, but doesn’t realize that hot water takes a while to arrive. He turns up the hot tap even higher and ends up getting a scalding.
Fed officials are increasingly looking out of touch, as they continue to act and sound hawkish, focusing largely on lagging indicators such as CPI, and failing to look at leading indicators such as the –Leading Economic index (LEI) and the Philly Fed manufacturing data, amongst others as outlined above.
Fed officials appear to have little concern over the state of the economy, despite forecasts from Fed staff released last week, which suggested a recession in the second half of the year. For Fed officials to continue to say – “inflation is still too high and proving to be stubborn,” “we are looking for further, sustained improvement in inflation”, the US economy is “resilient,” “we’re still seeing strong economic conditions”…and use that as an excuse to raise rates even further, is negligent and speaks of the lack of “private sector” experience among the current Federal Reserve officials.
Of the 18 members on the FOMC – six members of the Board of Governors of the Federal Reserve and the twelve Presidents of the Regional Federal Reserve Banks, only four have ever worked in the private sector. Of these, only Chairman Jerome Powell and Minneapolis Fed President Neel Kashkari, have private sector experience of over seven years.
To put it numerically – on average an FOMC member has 30 years of post-grad career history. Simple maths tells me that of the 540 years of post-grad career history of the 18 members on the FOMC, only 30 years i.e. 5% of the experience is in the private sector. The rest, 510 years since graduation, has been spent in academia or government positions. That’s not to say they aren’t qualified, however, wouldn’t you want more members on the FOMC with private sector experience i.e. those who have “participated” in the real economy, rather than just “watched”, or “spoken” about it at conferences, and “written” about it in academic papers?
I would.
The recession probability model (see chart below) from the New York Federal Reserve, continues to move up and is now at its highest since 1982.
New York Federal Reserve, probability of recession in the US – 12 months ahead
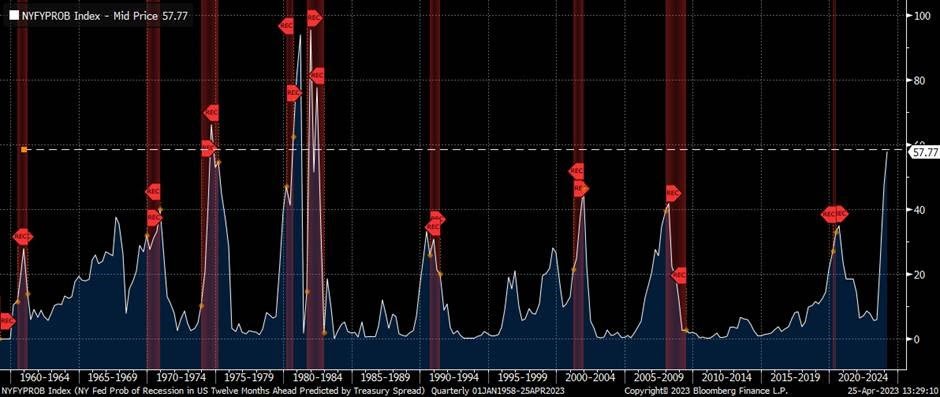
Source: Bloomberg
We’ve already seen the mistakes of such a group think – the Fed sticking with “zero rates” for longer, saying “inflation is transitory” and so on – and we may be seeing another one in the making as the Fed raises rates to a higher level than warranted.
Quantitative Easing (QE) wrecked the market’s ability to determine prices and interest rates and the stimulus that followed in the wake of Covid-19, distorted things even further. Under the “fiat money” regime that we have, “group think” can just add fuel to the fire.
It’s hard to imagine that Friedman would look at the current Fed and its bloated balance sheet favourably.
When reality hits, rate cuts will inevitably follow. The FOMC focus should return to preserving (and indeed encouraging) growth, and hence avoiding a “credit crunch” and preventing a recession.
Markets and the Economy
This week is all about “big tech” earnings. On Tuesday, we had a biggie from Microsoft (MSFT), which reported 3Q revenues of $52.9 billion, a +7% increase, thanks to beats across all its segments, led by personal computing. Everything from LinkedIn to Office 365 grew more than +10% in constant currency terms as the $2 trillion software juggernaut continued to roll. Microsoft’s shares, which were up +15% year-to-date (YTD), jumped more than +9%, in after-hours trading.
Microsoft expects the integration of Artificial Intelligence (AI) tools into the MSFT suite of products, to be the new growth area for revenues. It has invested billions of dollars in OpenAI, the company behind ChatGPT, and it owns 49% of the company. Will AI be the new revenue driver? Are programs like ChatGPT doing the “thinking” or merely faking it?
We seem to have forgotten about the “Metaverse” craze and the billions Facebook threw at it, only to recoil and correct course.
I use ChatGPT, but it is still just a fancy search engine/word processor with an easy-to-use front end. Despite the buzz and billions being spent on AI startups, we are not in sight of a breakthrough that can impart actual “human feelings” to a computer. Adding GPT to Word and Excel would however enhance the productivity of the MS Office suite, just as adding a motor to a manual screwdriver, can turn it into a power screwdriver and drive productivity.
While Alphabet’s (GOOGL) earnings were not as strong as MSFT, they still topped revenue estimates with $69.79 billion for the quarter, up +3% on the year, and beating expectations of $69 billion. Management kept a lid on costs, including capital expenditures with free cash flow of $17.2 billion coming in well ahead of the $13.5 billion expected by analysts.
Resilient demand for cloud computing and digital advertising together with cost cutting, has helped shore up “big tech” earnings overall.
US tech companies had been expected to produce little growth this quarter, if any, owing to difficult comparisons with the strong start they had to the quarter in 2022 and a spending slowdown that has hit many parts of tech service and product businesses. Therefore, seeing revenue growth is a piece of welcome news and points to the fact that big tech has been on a relentless drive of cost-cutting, increased efficiency and sound execution. We’re now seeing the results
America’s largest technology companies – Microsoft, Apple, Meta, Amazon etc. have all scrambled to identify efficiencies, cutting tens of thousands of jobs, amid heightened anxiety over the state of the US (and the world) economy. We are only one-third into the year and the tech sector layoffs in Silicon Valley for the year, have already surpassed the whole of last year. Almost 169,000 people have been let go since January this year, compared to 164,411 that were let go in the whole of 2022.
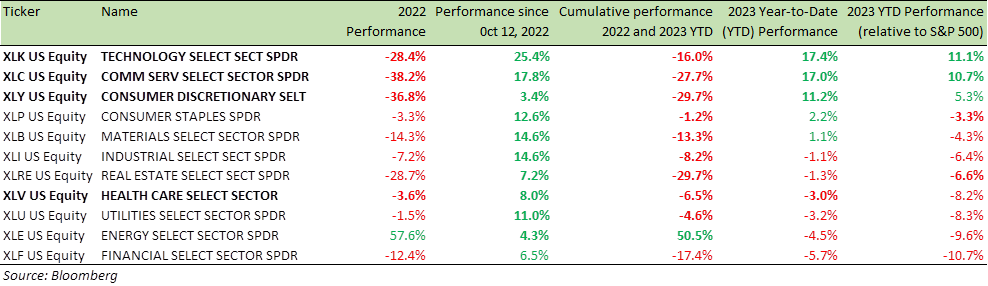
Despite the strong rally in equities since the market bottomed on Oct 12, 2022 (table below), Technology (XLK) and Communication services (XLC) stocks are still down between -15% to -27% from their December 2021 highs.
Benchmark US equity sector performance (2022, 2023 YTD and 2023 YTD relative to the S&P 500 Index)
May is upon us and the “Sell in May and go away” commentary – weaker returns during May to October compared to the period from November to April – has started to pour in.
Historically the adage does hold.
Post WWII, the S&P 500 (SPX) median performance during the winter months has been a gain of +6.2% with positive returns 75.6% of the time. During the summer months, however, the SPX’s median return has been less than half this, at +3.0%, with positive returns at 65.4% i.e. 10 percentage points weaker than the winter period.
However, like every other market maxim, “Sell in May” is not a hard-and-fast rule and the reality is more nuanced.
The charts below show that the performance and consistency of positive returns of both the SPX and National Association of Securities Dealers Automatic Quotation System (NASDAQ) during the summer months, is largely based on each index’s YTD performance through April 30.
- In the years the indices were significantly down (more than -5%) through April, the median returns during the summer months were negative for the indices – a decline of -6.3% for the SPX and a decline of over -10% for NASDAQ
- In all other scenarios when the index was down a little (less than -5%) or indeed positive YTD through April, the index median returns were positive during the summer months
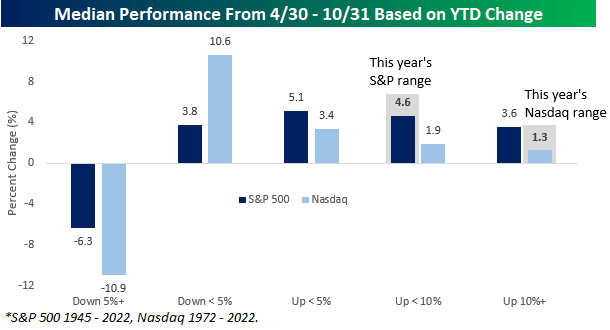
Source: Bespoke Invest
With one trading day left until the end of April, the SPX is currently up +5.7% and the NASDAQ is up +13%.
Here’s another reason why it doesn’t make sense to be bearish -positioning. Market consensus is bearish and equities are under-owned. Investors are 27.2% Bullish and 35.1% bearish, per the American Association of Individual Investors’ (AAII) stock sentiment survey. Bearish reading on the survey is above average for the 69th time out of the past 74 weeks. It’s hard to get a sustainable market crash when everyone is looking for it
- Furthermore, the Conference Board’s ‘bull-bear’ spread remained negative for 16 consecutive months. Going back to 1987, the current streak ranks as the second longest on record, trailing only the 18-month streak during the Financial Crisis that ended in April 2009. It reflects the prolonged consumer pessimism towards equities that started in Q2 2021. In the year following previous streaks of nine months or more with negative sentiment, the S&P 500’s performance was consistently positive, suggesting that pent-up demand for stocks may emerge, once pessimism subsides
- Despite the rally we have seen from the October 2022 lows, the SPX and NASDAQ are still -15% and -24% below their December 2021 highs
Benchmark Global Equity Index Performance (2022, 2023 YTD and 6 months)

Meanwhile, in the second largest economy in the world – China, consumer spending is playing a stronger-than-expected role in driving its recovery, after the country lifted its stringent zero-Covid measures. Beijing’s National Bureau of Statistics said Tuesday that the economy grew by +4.5% in the first three months of the year, when compared with a year earlier, the fastest such rate of growth since the first quarter of 2022, and a marked improvement from the +2.9% rate in the last three months of last year.
The strength of China’s economic recovery in Q1, free of its Covid restrictions marked a bright spot for a global economy facing various headwinds – inflation, higher interest rates and fallout from instability in the financial sector.
Very encouragingly, China’s growth in Q1 was driven in large part by retail sales, which jumped more than +10% in March from a year earlier. That was the fastest pace in nearly two years, and helped to offset a sharper-than-expected slowdown in real estate, infrastructure and other private-sector investments. This is a welcome change from the past quarter where the economic boom had been largely built on an investment-driven model which often leads to malinvestments and bubbles in the economy. Since this sharp rebound in consumer spending is largely organic and not driven by government stimulus, Q2 growth could easily get to +6% or more. That would be a bright spot for global economic sentiment.
S&P 500 Index – 12-month price chart
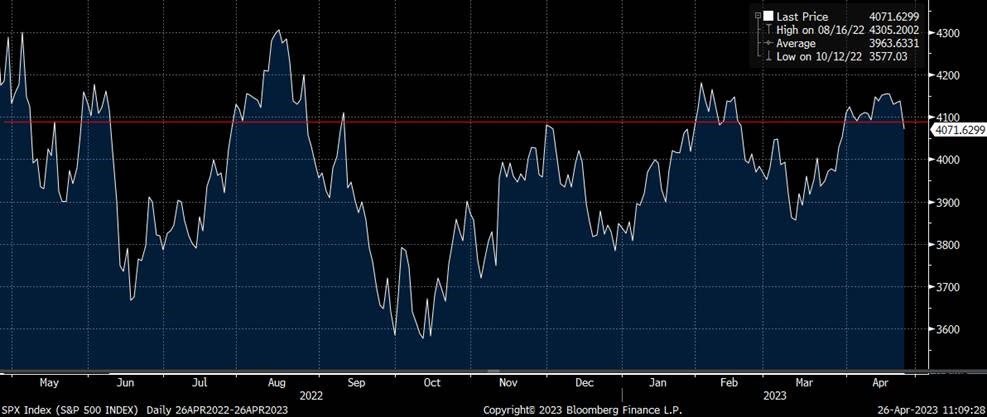
Source: Bloomberg
The SPX has been flat for the last 12 months (see chart above) and we may get more sideways moves in the months ahead. In such circumstances, clipping a 10%-12% p.a. coupon on a basket of large-cap stocks using income-Structured Products is still my favourite play.
For specific stock recommendations and Structured Product ideas please do not hesitate to contact me or your relationship manager.
Best wishes,

Manish Singh, CFA