

“The S&P 500 has risen +10% since the US Federal Reserve raised interest rates. It’s almost surreal to see that the Japanese Yen has lost more value during March than the Russian Ruble. If the Yen were to continue weakening, China may be forced to weaken the Yuan in a repeat of what we saw in 2014-15.”
Summary
The Japanese Yen (JPY), the world’s third-largest reserve currency, is having a bad month.
At one stage, the Yen was down -7% in March and USDJPY hit 125, a near two-decade low. The last time JPY weakened to such an extent in 2014-2015, China was forced to weaken its currency (CNY) to rebalance the terms of trade. The result of this CNY weakness, was a big rally in Chinese equities. The Shanghai Composite Index (SHCOMP) doubled between February 2014 and May 2015. Given the bearish sentiment surrounding Chinese equities, a series of weak fixings for CNY could deliver a stellar rally in SHCOMP. So, watch out for more moves in JPY and CNY. In view of what’s happening in the world, it’s almost surreal to see that the Japanese Yen has lost more value during March than the Russian Ruble.
Last week, Russia announced that Moscow will now only accept Rubles (RUB) as payment for natural gas deliveries to “unfriendly” countries, which includes the European Union (EU). Russia reiterated this demand this week and is not backing down. Russia supplies around 40% of EU gas consumption. The EU’s trade deficit with Russia of €58.5 billion, is only going to get worse, as the EU has continued to import energy whilst banning any exports to Russia. The EU better be prepared for energy rationing, have enough gold to buy RUB, have aces up its sleeve or be ready to make an embarrassing about-turn. This just goes to show the importance of energy to the world. Russia’s invasion of Ukraine is a despicable and dastardly act, but the economic reality is that Russia cannot be sanctioned and treated like North Korea, without inflicting a huge economic cost to those sanctioning.
The S&P 500 index (SPX) may still be negative territory for the year, it has however surged more than +10% since mid-March. The market is yet to fully embrace the rally and turn bullish. This means there’s more upside to come, particularly when the equity market starts pricing in fewer than six interest rate hikes for the year.
Japanese Yen loses more value than Russian Ruble during March
While everyone is focused on the Ukraine-Russia war, (no Mr Putin, it’s not a special military operation!), the bigger story, in financial circles, is the weakness of the Japanese Yen (JPY).
JPY, the world’s third-largest reserve currency (the US dollar and the Euro being the top two) is on track for one of its worst monthly performance ever (please see chart below).
The prospects of widening US-Japan interest rate differentials have pushed the USD/JPY higher and on Monday JPY hit 125 against USD, the highest since August 2015. That’s a loss of nearly -7% for the month. The Yen has recovered since and currently trades at 122 per USD. If the Yen sell-off resumes, hitting 125.52, would be a two-decade low for the currency.
The Bank of Japan (BoJ) has pledged to keep monetary policy loose, in contrast with most other major central banks, which are in tightening mode or getting ready to tighten monetary policy. The yield on the benchmark 10-year Japanese Government Bond (JGB) hit a fresh six-year high of +0.250%, even after the BoJ stepped into the market with an offer to buy an unlimited amount of JGBs to defend the implicit +0.25% ceiling set around its yield target.
BOJ Governor Haruhiko Kuroda has repeatedly said the central bank would maintain interest rates at the current ultralow levels, given the fragile economic recovery and as inflation remains well below its +2% target.
25 year chart: Japanese Yen (USD/JPY) price, Chinese Yuan (USD/CNY) price and USD/JPY monthly price change
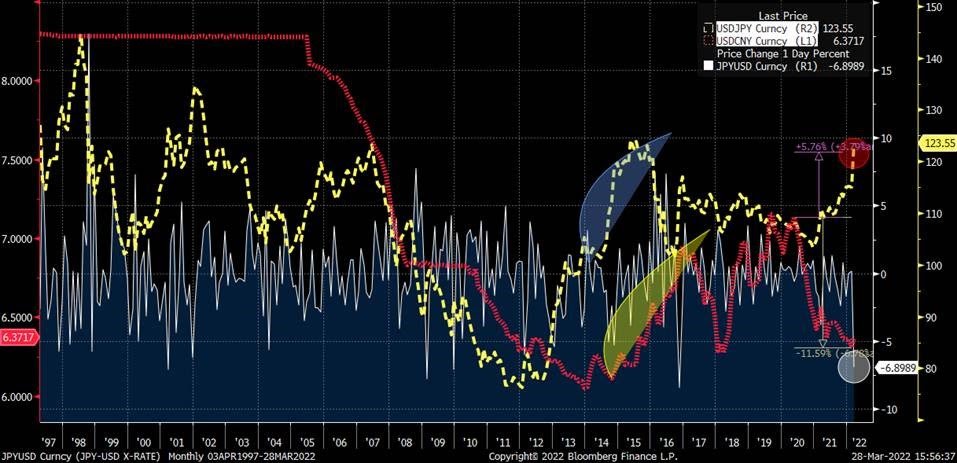
Source: Bloomberg
I don’t believe Japan will be particularly worried about this weakness in the Yen, as it means Japanese manufacturers will have a lower cost in dollar terms and gain an edge over other exporters.
Japan’s Vice Minister of Finance for international affairs, Masato Kanda said: “The market determines the exchange rate. We will respond appropriately while maintaining close communication with the U.S. and other monetary authorities.”
China, on the other hand, will be watching this with great interest, as the Chinese Yuan has strengthened by over +11% since June 2020 and the JPY has weakened by over -6% in the same period i.e. the terms of trade for Chinese exporters selling to the American consumer is -17% worse compared to their Japanese competitors.
One explanation for this move is that we are seeing a revival of the “carry trade” – investors borrowing in Yen at low rates, selling the Yen and buying US dollars to earn a higher rate of interest.
If President Donald Trump were still in the White House, he would have cried foul and labelled Japan a currency manipulator by now. US President Joe Biden on the other hand, will welcome a strong dollar, as it pushes the cost of imported goods down and tempers inflation – Biden White House’s biggest concern going into mid-term elections.
China on the other hand will be less charitable about the Yen weakness. The last time JPY weakened to such an extent in 2014-2015, the Chinese were forced to weaken their currency CNY to rebalance the terms of trade (see the yellow shaded region in the chart above).
The result of this weakness in CNY was a big rally in Chinese equities. The Shanghai Composite Index (SHCOMP) doubled between February 2014 and May 2015. Given the bearishness surrounding Chinese equities, a series of weak fixings for CNY, if necessitated, could deliver a stellar rally in SHCOMP.
So, watch out for more moves in JPY and CNY.
One other currency is on the move, for entirely different reasons – is the Russian Ruble (RUB). It has rallied +28% this month even as the Ukraine-Russia war rages on. It’s almost surreal to see that the Japanese Yen lost more value during March than the Russian Ruble.
The RUB, which touched 177 RUB per US dollar (USD) on March 7, is currently trading at 82 RUB per USD. This is due to targeted market interventions by Russia’s central bank and strong Oil & Gas revenues. The RUB may very soon look stronger than before the war. On February 23, the day before the Ukraine invasion RUB closed at 81.67 per USD. So what’s changed?
Russia’s demand last week that Moscow will now only accept RUB as payment for natural gas deliveries to “unfriendly” countries, which include the European Union (EU), could prove significant and force Europe – which has no access to RUB but needs Russian gas – to ease or end sanctions on Russia.
The demand is designed to make sanctioning nations reconsider their plans, support Russia’s currency and in turn support the Russian economy. This is Europe’s worst energy crunch since the 1970s and European gas prices surged over +30% after the news of Russian demands for payment in RUB.
Russia is not backing down and it reiterated on Tuesday that it will only be accepting payment for gas deliveries to the EU in RUB after G7 ministers called this arrangement “unacceptable.” Russia continues to supply around 40% of EU gas consumption.
In 2021, the total trade in goods between the EU and Russia amounted to €257.5 billion. The EU’s imports were worth €158.5 billion dominated by fuel and mining products, and exports totalled €99.0 billion i.e. a trade deficit of -€58.5 billion. This deficit will only get worse as the EU has continued to import energy while banning exports to Russia.
Also, India is set to launch a new system to allow it to make direct Rupee-Ruble payments in trading with Russia. It will allow India and Russia to bypass the US dollar in financial transactions.
This just goes to show the importance of energy to the world. Over the past month, Russia has overtaken both Iran and North Korea to become the most sanctioned country in the world. Western nations will realise that Russia is too vast and crucial for the global economy, for it to be sanctioned and treated like North Korea.
Most gas delivered to the EU is paid for in Euros, but Russia wants to change this to Rubles

Source: pixaby
If Russia doesn’t back off, how does the EU get RUB to pay for gas given the EU sanctions bar the EU nations from selling goods to Russia?
Well, it seems Russia has thought this through. The Central Bank of Russia announced that starting from March 28, the Ruble will be bound to gold – 5,000 RUB per gram of gold i.e. you want RUB to pay the gas bill, buy them with gold. This in a way completes Russia’s plans to sell oil for gold. RUB may be far away from a reserve currency status but the implications of RUB as payment currency for Russian gas is just beginning to take shape.
The EU better be prepared for energy rationing, have enough gold to buy RUB, have aces up its sleeve or be ready to make an embarrassing about-turn.
On the Ukraine-Russia war front, there is a guarded sense of relief as the Kremlin confirms the scaling back of the invasion to the ‘liberation’ of Donbas. It is the strongest indication yet that President Vladimir Putin’s aims of war are changing, after the invading Russian forces met a resolute Ukrainian resistance, denying Putin the quick victory he wanted. Over a month into the invasion, Russia has failed to capture any major city and has suffered heavy losses. Let’s hope Russian guns falls silent soon and a Ukraine-Russia compromise is worked out to alleviate the suffering of the Ukrainian people.
Markets and the Economy
The sell-off in the Bond market continues with the US 10y Treasury Yield now over +2.4%, the highest in 2 years.
The US U.S. Aggregate Bond ETF (AGG) is now down -5.8% year-to-date and over -11% since the highs of July 2020, when the US 10y was trading at a paltry yield of +0.54%.
Bond yields are the talk of the town and with the US yield curve getting flatter by the day, as the market prices in an aggressive rate-hiking plan by the US Federal Reserve (the Fed), it seems an inversion of the yield curve – the “2s10s spread” or the difference between the 10-year US Treasury yield and the 2-year US Treasury yield turning negative – is a matter of “when” not “if”.
The 2s10s spread which was as high as +0.85% at the beginning of the year has now fallen to +0.034%.
Typically, the yield curve slopes upwards. Investors expect more compensation for holding longer-dated bonds, as they expect rising inflation to lower returns over time. This means a 10-year bond typically yields more than a 2-year bond, as it has a longer duration.
A steepening yield curve also signals expectations of stronger economic activity, higher inflation, and higher interest rates. A flattening curve by contrast means the opposite – expectations of weaker economic activity and rate hikes in the near term. The current spread on 2s10s would indicate that the market has been doing the “tightening” job for the Fed.
Does a Yield curve inversion, mean a US recession is imminent?
An inversion of the yield curve is an indicator of an oncoming recession. The US yield curve has inverted before each recession since 1955, with a recession following between 6-24 months, according to a 2018 report by researchers at the Federal Reserve Bank of San Francisco. It offered a false signal just once in 1998. The last time the 2s10s inverted was in 2019. The following year, the US entered a recession – albeit one caused by the Covid-19 pandemic.
However, there’s an interesting occurrence this time around.
While the 2s10s is indicating slowdown, another closely monitored spread – the 10Yr/3 month spread (the difference in the yield on the 10-year Treasury notes and the 3-month Treasury bills) has been widening (the highlighted red circle in the chart below).
US Treasury Yield curve: 2-Year vs 10-Year
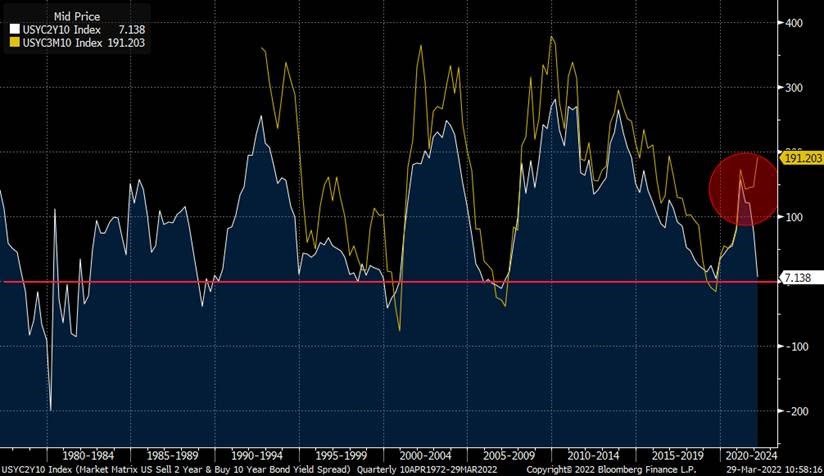
Source: Bloomberg
You will notice that in all previous cases of curve inversion both the 2s10s and the 10Yr/3 month spread moved in lockstep and inverted.
Has Quantitative Easing (QE) distorted the long end of the yield curve permanently due to massive bond-buying by the US Federal Reserve? Perhaps it has and therefore the 10-year yield is lower and will likely rise when the Fed starts shrinking its balance sheet, thus steepening the curve.
While it’s not easy to say whether we will see a recession in the US over the next 6-12 months, what is of little doubt is the concerns about the future economy are building up fast and rising bond yields are indicators of this.
What does this mean for the equity market? Should one be concerned about the equities keeling over?
Not so fast.
Over the last 50 years, there have been six episodes of 2s10s yield curve inversion.
The table below outlines the performance of the S&P 500 index (SPX) in the first year after inversions of the yield curve. You will notice that the performance hasn’t typically been negative.
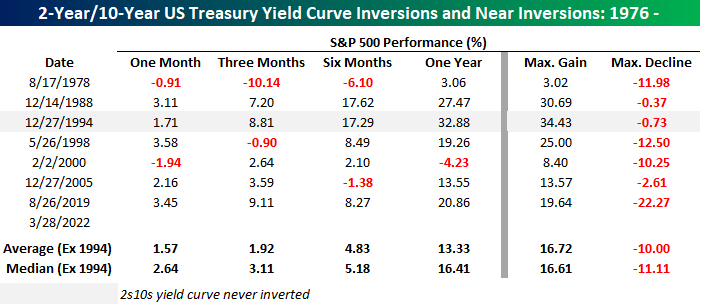
Source: Bespoke Invest
- In the December 1994 curve inversion, The SPX index was sharply higher over the following one, three, six, and twelve months.
- In the five other periods where the yield curve inverted, the forward returns for SPX were also generally higher. One, three, and six months later, the SPX was higher two-thirds of the time, and a year later, it was higher five out of six times for a median gain of over +16%.
- The only time it was lower a year later was after the inversion in February 2000 when the SPX fell by -4.23%. That was the “dotcom” bust and on that occasion, the SPX continued to show weakness and didn’t bottom until October 2002.
One other key consideration this time around to bear in mind – in all seven prior cases of 2s10s yield curve inversion, the SPX was higher in the three months leading up to the inversion. This time around, if the curve does invert shortly, it will mark the first time that the SPX declined in the three months leading up to an inversion.
The SPX is down -3.4% over the past 3 months.
The SPX may still be negative for the year (table below), it has however surged more than +10% since mid-March.
This recovery in US equity indices has continued to flummox investors who are focused on the surge in bond yields and the insistence by the Federal Open Market Committee (FOMC) that they will act aggressively to clamp down inflation.
In last month’s Market Viewpoints I wrote – “A lot of a bearishness is already priced in to equity markets and there is a likelihood that those expecting more bad news may be hit by surprises …there is room for a catch-up rally in equities. It’s time to build back equity exposure.”
If you did add to your equity position then you must be feeling cheerful. The AAII Net Bulls index (a weekly sentiment survey of AAII members, which asks if they are “Bullish,” “Bearish,” or “Neutral” on the stock market) that I refer to in the newsletter has recovered from -60 but it still sits at -43 and down from the long-term average of -23.
Benchmark Global Equity Index Performance (2021 and 2022 YTD)
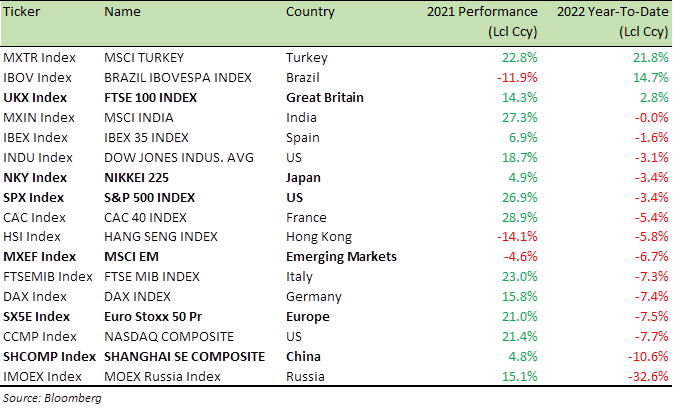
The market is yet to fully embrace the rally and turn bullish. It means there’s more upside to come, particularly when the equity market starts pricing in fewer than six interest rate hikes for the year.
As I’ve written for a few months now, I do not believe the Fed can deliver on what the market is pricing in – five to six additional rate hikes this year.
On 16th March, I was on Bloomberg TV to discuss the outlook for rates and equities. Please skip to 26 mins at this Bloomberg YouTube link to see my remarks.
Chinese stocks have also seen a turnaround this month, on the back of market intervention by China’s Vice-Premier Liu He.
China’s Financial Stability Development Committee met on March 16 and the meeting was chaired by Liu He, President Xi Jinping’s closest economic adviser. He signalled a shift in policy thinking, with a call to pay more respect to investors’ interests. He further indicated that the government would take measures to “boost the economy in the first quarter”, as well as introduce “policies that are favourable to the market”. Chinese tech stocks like Alibaba (BABA), Tencent (TECHY), JD.com (JD), Baidu (BIDU) are up between +35% to +50% since the announcement.
In response to Liu He’s meeting, the regulatory body that oversees China’s securities and futures industry, the China Securities Regulatory Commission (CSRC) quickly came out with a list of things they will do – “Encourage stocks buybacks, encourage mutual fund companies put in their own capital”
When it comes to understanding China, only the words of the Chinese Communist Party (CCP) matter and they have indicated support for the market. This will draw domestic capital into the beaten-down Chinese stocks. Chinese tech stocks have further to run as most of them are still down more than -50% from the highs despite the sharp rally of the last ten days.
Benchmark US equity sector performance (2021, 2022 YTD)
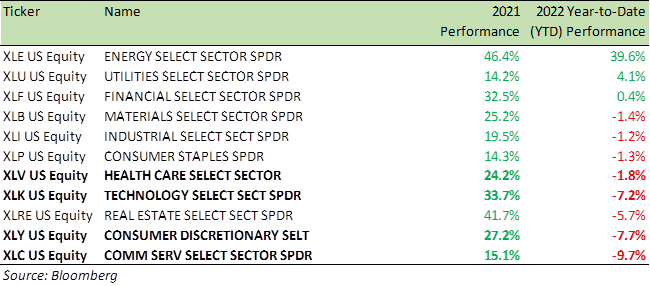
Despite the over +10% rally in the SPX, Consumer Discretionary (XLY), Communications (XLC), and the Technology (XLK) sectors are still down over -7% (see table above) and present the best opportunity for stock picking. Growth and Tech stocks will particularly benefit from any re-pricing in the number of interest rate hikes.
For specific stock recommendations and structured products ideas please do not hesitate to get in touch.
Best wishes,

Manish Singh, CFA