


“Inflation is easing, equities remain resilient despite short-term volatility, and rate cuts are now firmly on the table.”
Summary
The latest US Labor Department report showed 263,000 first-time jobless claims – well above expectations and the highest since October 2021. Combined with weak payroll growth, this reinforces the growing fragility of the US labour market. Inflation data suggests modest easing at the consumer level, while producer prices point to potential deflationary pressure. The Fed’s preferred inflation gauge, the Personal Consumption Expenditure (PCE) index, won’t be released until later this month. But the bond market isn’t waiting. The US 10-year yield is on the verge of breaking below +4%, as investors increasingly price in a looser policy path. Futures now imply three rate cuts by year-end and six by the end of next year. As interest rates fall, the critical question is whether the $7.3 trillion currently sitting in US money market funds begins moving into risk assets. We won’t have to wait long to find out.
Technological breakthroughs often reset the rules of competition, creating new winners while leaving others behind. Just as alternating current displaced direct current and reshaped the energy sector, today’s AI, cloud computing, and infrastructure revolutions are beginning to challenge established market leaders. Companies that adapt and innovate may find outsized rewards; those that don’t risk irrelevance. Disruption rarely moves in straight lines, but history is clear—transformation brings both risk and opportunity, and investors need to be positioned for both.
Despite some near-term volatility, the broader equity market remains resilient. Strong corporate earnings, accelerating investment in transformative technologies—particularly AI—and the prospect of falling rates continue to underpin confidence. While short-term corrections are always possible, the structural backdrop suggests the rally still has meaningful room to run.
US Labor Market Fragility Puts Fed on Track for Cuts
In July, US Federal Reserve (Fed) Chair Jerome Powell described the US labour market as “solid – historically low unemployment.” Six weeks later, the data tells a very different story.
The August jobs report showed only 22,000 payroll gains, while June was revised down to a 13,000 loss – the first decline since 2020. The three-month average has slumped to 29,000 – the weakest in five years. Unemployment climbed to 4.3%, its highest since October 2021, while cumulative payrolls have now been revised down by over 2 million across the past three years.
The Bureau of Labor Statistics’ preliminary benchmark revisions:
- 2023: -306,000
- 2024: -818,000
- 2025: -911,000
That’s more than two million jobs that never existed – an unprecedented downgrade, surpassing the previous record revision of -824,000 in 2009 during the global financial crisis.
It would appear that when the Fed pressed ahead with rate hikes last year, it was tightening into an already fragile labour market—one whose weaknesses were masked by the liquidity and fiscal support unleashed under former US President Joe Biden. The broader economy may have avoided a technical recession, but the jobs market was effectively in one.
U.S. Jobs Report: First negative print since December 2020
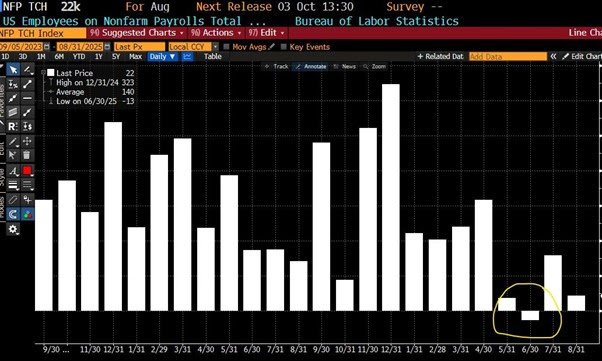
Source: Bloomberg
Additionally, a separate US Labor Department report this week showed 263,000 first-time jobless claims, surpassing expectations and marking the highest level since October 2021. This surge, coupled with sluggish job growth, underscores the growing fragility of the US labour market.
This week’s other key data releases – August Consumer Price Index (CPI) and Producer Price Index (PPI) – set the stage for this week’s Federal Open Market Committee (FOMC meeting on September 17.
- Consumer Prices (CPI): Headline inflation rose +2.9% YoY (up from +2.7%), with core CPI (excluding food and energy) steady at +3.1%, and month-on-month gains of +0.3%, in line with forecasts
- Producer Prices (PPI): Final demand PPI fell -0.1% MoM, driven entirely by trade services, which declined at a -19% annualised rate – tying the fastest drop in the series back to 2009. Core PPI (excluding food, energy, and trade services) rose +4.0% annualised, slower than last month, but still robust. Lower energy prices also weighed on headline PPI
Both readings point to modest easing at the consumer level, while producer prices raise some deflationary concerns.
Tariff-driven price pressures remain uneven. Cars and clothing saw faster increases, while items like tires and furniture showed only muted gains. Groceries, however, surged – up +0.6% in August, with coffee up +21%, beef steaks +17%, and apples +10% over the past year.
This raises an important question: Are tariffs fuelling a temporary inflation spurt, or something stickier?
I see the potential for a one-off inflation spike – for example, coffee prices jumped +21% after President Trump imposed a 50% tariff on Brazil. But consumer behaviour will eventually push back: People may simply delay or forgo purchases. This adjustment can happen quickly, creating rapid deflationary pressure.
For me, the outlook is clear: Disinflation is the path forward, not persistent inflation.
The Fed’s preferred inflation gauge, the Personal Consumption Expenditure (PCE) index, won’t be out until later this month, though forecasters expect a softer reading than CPI.
Still, the central dilemma lingers: Are tariff-driven price hikes temporary, or do they risk embedding into wages and broader inflation, as in 2021–22?
The answer may not be clear until well into next year – leaving the Fed to navigate policy with more uncertainty than clarity.
The bond market is not waiting for Fed. The US 10-year yield is poised to break below +4% and as investors price in a much looser policy path. Futures markets now imply three rate cuts by year-end and six by the end of next year (see chart below)
Fed rate-cut bets, as priced by Money Market Futures
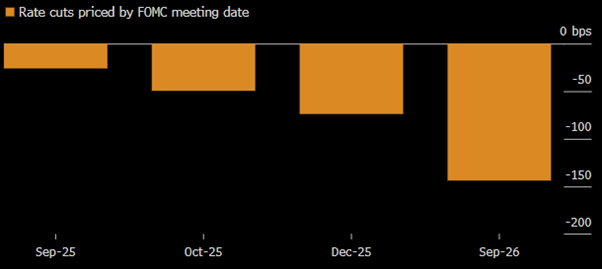
Source: Bloomberg
Historically, US rates have hovered only marginally (50-100 bps) above ECB levels (see chart below). Today, they are 235 bps higher. Against this backdrop, the fourth quarter is shaping up to be highly consequential for both markets and policymakers.
Meanwhile on the US GDP growth front, US growth showed resilience in Q2, with GDP expanding at an annualized +3.3%, a rebound from the Q1 contraction and evidence that domestic demand – particularly consumption and a drop in imports – supported activity.
Business surveys however tell a split story. The ISM manufacturing PMI remains in contraction territory at 48.7 in August, signalling continued factory-sector weakness and softer production and employment in goods-producing industries.
By contrast, ISM’s services index rose to 52.0, indicating modest expansion in services and stronger activity in areas like new orders and business activity.
S&P Global’s PMI composite also points to continued expansion, with the composite at the mid-50s – consistent with steady, if not blistering, growth.
Importantly, America’s technology leaders have pledged massive domestic investments that could help offset broader economic weakness.
Apple and Meta have each pledged $600bn in US investment through 2028, Google committed $250bn, and Microsoft is ready to spend up to $80bn a year—part of nearly $400bn in AI infrastructure spending this year alone.
With OpenAI and Anthropic raising billions at valuations nearing $500bn, analysts see global data-centre outlays topping $3trn by 2028. Corporate America is betting big that AI will power the next leg of growth.
As interest rates come down, the big question is whether the $7.3 trillion currently parked in US money market funds will begin rotating into risk assets?
We shall find out soon enough.
President Trump continues to demand aggressive rate cuts while questioning Powell’s leadership. Trump would like a 75bps rate cut this week, but that is unlikely. Chances of a 50-bps rate cut are not insignificant anymore, with Polymarket indicating a 20% probability.
Markets and the Economy
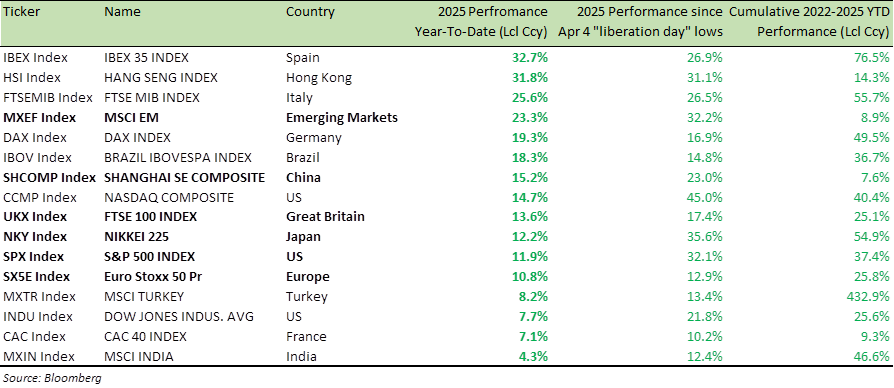
Last week, the blue-chip Dow Jones Industrial Average (DJIA or The Dow) index surpassed 46,000 for the first time. The S&P 500 (SPX) and Nasdaq have now hit records 24 times this year, and are both up at least +12% year-to-date (YTD, see table below).
On the bright side, the spending as outlined in the section above continues.
On the whole, price increases this year haven’t been as stiff as feared this spring, when Trump announced large and broad increases in tariffs.
And if there’s a downturn, rate cuts are coming. This has kept the equities well supported (see table below).
Global Equity Index Performance (2025 YTD, since April 4 YTD and 2022-25 YTD)
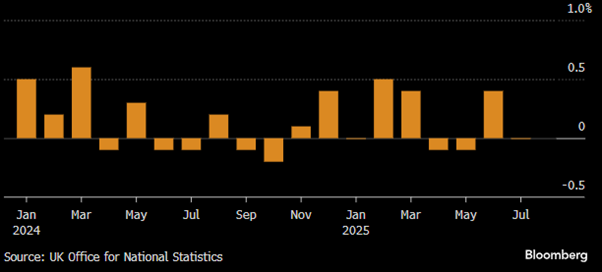
Meanwhile in the UK, the UK economy has stalled. The latest Office of National Statistics (ONS) data, showed GDP flat on the month, with services barely expanding while industrial output dropped -0.9% and manufacturing fell -1.3%. These figures highlight how the drag from past tax hikes is biting, while the prospect of further fiscal tightening in the upcoming budget adds to the headwinds.
The Labour government of UK Prime Minister Keir Starmer, looks paralysed by its own contradictions. Labour’s majority counts for little when it can’t even pass its own welfare bill – a measure that could have trimmed spending, improved fiscal headroom, and created space for growth-friendly tax cuts. Instead, ministers are hostage to activists, MPs to ministers, and the Prime Minister to his own shadow.
The Bank of England (BoE) meets this week and is expected to hold rates at +4%, after five cuts since last summer. Policymakers face an impossible balancing act: Growth is weak, and the labour market is softening, yet inflation at +3.8% remains stubbornly above target.
In Westminster, “full confidence” from the Prime Minister has become the kiss of death – first for Angela Rayner, then Peter Mandelson. One can only hope he quickly extends the same to Ed Miliband. With the UK still burdened by the highest energy prices of anywhere in the developed world, stifling what’s left of its manufacturing base, millions of Britons would welcome both the endorsement and the results it could bring.
What the UK needs are tough decisions on spending, starting with public sector pensions and final salary schemes. A reduction in the civil service through natural attrition, to simply bring government in line with the private sector. Instead, we face the grim prospect of more taxes and less money in people’s pockets – a path that leads only to deeper stagnation.
A government hamstrung by internal divisions and stalled reforms leaves little room for decisive fiscal support. For investors, the combination of policy paralysis, high energy costs, and structural drags points to continued underperformance in UK assets – GBP and Gilt relative to peers.
The UK economy stagnates: UK GDP growth, month-on-month
On the continent, the European Central Bank (ECB) held its benchmark rate at +2% for the second consecutive meeting.
ECB President Christine Lagarde emphasized that “the domestic economy is showing resilience, the labour market is solid, and risks are more balanced,” adding that inflation is “where we want it to be.” The decision followed the EU’s trade deal with the US in late July, which imposed 15% tariffs on much of the bloc’s exports.
Eurozone inflation rose slightly to +2.1% in August, while revised forecasts now point to +1.7% in 2026, up modestly from +1.6% in June, indicating a slight upward shift in medium-term expectations.
The ECB has largely tamed inflation, and prices appear set to continue falling. So why not support the economy with a rate cut? Businesses facing higher US tariffs could certainly use the relief. Yet with Eurozone rates already over 200bps below those in the UK and US, the ECB has limited room to manoeuvre if growth surprises to the downside.
Bond investors have endured one of the most difficult stretches in modern history. The Bloomberg US Aggregate Bond Index (LBUSTRU), the broad benchmark for fixed income, has delivered an average annual return of roughly 0.0% over the last five years — a sharp reversal from its +4.1% average over the past 25 years and +6.7% since 1976.
On a rolling 2-, 5-, and 10-year basis, returns sit in the bottom 1% of all historical observations.
This weakness marks the end of the four-decade bond bull market (1980s–2020), when steadily falling interest rates drove consistent gains. The rapid rate hikes beginning in 2022 triggered historic losses, especially in longer-duration Treasuries. Yet, there are signs of renewal with rate cuts ahead and bond yields today are the most compelling in over a decade:
Bloomberg Global Aggregate Bond Index – highest since December 2021
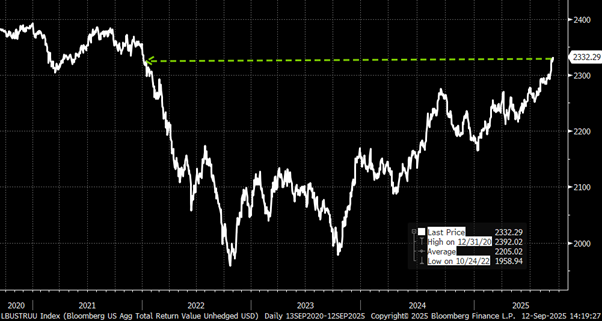
Source: Bloomberg
With inflation easing and rate cuts increasingly likely, the rest of 2025 and 2026 are shaping up as a much friendlier environment for fixed income.
It has been a brutal half-decade, but in markets – as in life – it’s always darkest before the dawn.
Shifting to an asset class we don’t discuss often – Private Equity (PE) and alternatives.
A recent Wall Street Journal piece on endowments really caught my eye. I’m not a fan of investing in PE, just for the sake of diversification. It’s often marketed that way, but that marketing can lure investors into long lock-ups, illiquidity, and promised returns that rarely materialize. Evaluating these investments is notoriously difficult, and the glossy Internal Rate of Returns (IRR) you see, are often not a true measure of performance, leaving them open to manipulation.
Endowments, which are a good proxy for PE-heavy portfolios, are reporting returns clustering around +8–10% (see chart below), and that’s still based on valuations I suspect are overstated. The era of “easy alpha” in private equity seems increasingly over.
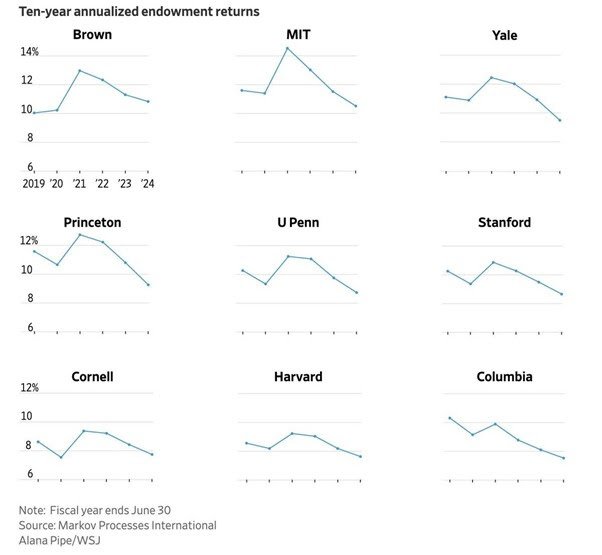
Typical Endowment allocations are roughly:
- Private Equity: 30–40%
- Public equities: 25–35%
- Real assets (real estate, infrastructure): 10–15%
- Fixed income/hedge funds: 10–15%
It seems the alpha disappears once everyone follows the same playbook: Pile into PE and lock up capital for a decade.
As I often remind people: If you can compound at +10–12% annually in listed equities, you’ll outperform most hedge funds or private equity over a 5–10 year cycle. Those flashy +20% IRRs usually compress to something closer to 8% annual cash-on-cash when measured properly.
The power of compounding over 10 years is striking:
10% p.a. turns $1 → $2.6
11% p.a. turns $1 → $2.83
12% p.a. turns $1 → $3.1
I have nothing against Private Equity – they’ve mastered a compelling sales pitch, and some firms genuinely deliver. But those are the exceptions, not the rule. Hopefully, endowments and private investors are starting to realize this – and early signs suggest they are.
There are now more exchange-traded funds (ETF) than individual stocks. We’ve created more baskets than there are apples to fill them.
Every niche, sector, and theme seems to have its own ETF, and the proliferation shows no sign of slowing. Maybe that’s a signal that active investing is due for a comeback. When the shelves are overflowing with passive options, skilful stock pickers who can cut through the noise may finally find their moment.
I’m not saying we’ve hit peak ETF – far from it – but it’s hard to ignore that the market is already well-stocked. At some point, having too many baskets might just remind investors why focusing on the fruit inside still matters.
Bull markets in equities typically last four times longer than bear markets, and this current run is far from over.
Despite periodic volatility and pullbacks, the bull market shows few signs of exhaustion. Strong corporate earnings, robust technology investments -especially in AI. -and supportive monetary conditions continue to underpin investor confidence. While short-term corrections may occur, the broader trend suggests the equity rally still has considerable runway.
Looking at technology specifically, the trajectory of the Nasdaq following the release of ChatGPT in October 2022 mirrors the path after Netscape’s 1994 debut—the browser that made the internet accessible to mainstream users and sparked the Dot Com Boom.
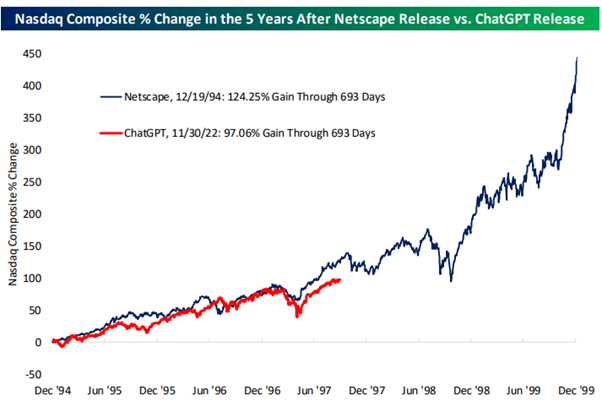
Source: Bespoke Invest
Netscape’s debut in 1994 was a watershed moment: it made the internet accessible to millions, fuelled enormous excitement about the digital future, and helped trigger a surge of investment and innovation that defined the late 1990s.
The release of ChatGPT synonymous with AI, LLM and expanding data centre spend shows the strongest correlation to Netscape’s launch.
As illustrated in chart above, the two patterns remain strikingly similar.
By late 1997, the Nasdaq had climbed slightly higher than its current level, but the overall resemblance endures. If history serves as a guide, the AI Boom still has substantial room to grow in the coming years. A relentless investment race is underway, with tech giants pouring resources into the computing power required for increasingly sophisticated AI models.
Just as alternating current (AC) eventually overtook direct current (DC) in 19th-century America, reshaping the entire electricity industry, innovations can transform sectors in ways that catch investors off guard.
Thomas Edison championed DC, which powered early electric grids, but it had severe limitations in transmitting electricity over long distances. Nikola Tesla and George Westinghouse promoted AC, which could efficiently carry power across cities and regions. Firms tied to DC infrastructure were forced to adapt, consolidate, or disappear, while AC became the industry standard, creating massive value for the winners.
This episode illustrates a broader lesson for investors today: Technological breakthroughs often redefine the competitive landscape, leaving some companies behind and propelling others to dominance. Just as AC disrupted DC, AI, cloud computing, and other emerging technologies may upend current market leaders, rewarding those that innovate and penalizing those that fail to pivot. The path of progress is rarely linear, and historical precedent reminds us that disruption can create both risk and opportunity in equal measure.
Hence, I highlight the value of equity structured products, as a highly effective investment tool to manage and potentially capitalize on increased market volatility. These products offer a degree of capital protection, while helping to identify advantageous entry points. They also present opportunities to generate returns, even in flat or declining market conditions.
Yet today’s financial system appears well-positioned to absorb shocks. Unlike past bubbles—such as Britain’s railway crash in the 1860s, which triggered bank losses and a credit crunch – much of today’s AI infrastructure spending is being financed from big tech’s deep cash reserves, robust earnings and free cash flow reducing systemic risk while fuelling continued growth.
For specific stock recommendations and insights related to structured products, please do not hesitate to reach out to me or to your dedicated relationship manager.
Best wishes,

Manish Singh, CFA