

“Chairman Jerome Powell’s recent remarks, recent market movements and what these developments might mean for the future”
Summary
July has proven to be a rollercoaster month for the markets. Despite numerous fluctuations, the S&P 500 has impressively advanced by +16% this year. In a typical year, such a return would be highly celebrated; however, this year’s AI-driven tech stock surge and broader market gains have heightened expectations. Notably, the market’s breadth-the balance of advancing and declining stocks within the index-is improving. This suggests that market pullbacks may present buying opportunities, indicating potential for continued upward momentum in the coming months.
This month’s market dynamics reflect the effectiveness of past rate hikes in tempering inflation, amidst evolving supply and demand conditions. Recent data pointing to a softening labour market has weakened wage bargaining power, advocating for potential rate cuts to uplift market sentiment and enhance housing affordability.
At the beginning of this year, the probability of rate cuts at the Federal Open Market Committee (FOMC) meetings in March, May, June, and July was over 80%. However, no cuts were made at any of these meetings, including the one in July. At the July meeting, Chair Jerome Powell emphasized the downside risks related to the labour market and the FOMC’s close monitoring of labour market trends. It sets the stage for cuts at the September meeting.
Market volatility and drawdowns are not anomalies but rather inherent features of investing and should be anticipated, embraced and strategically addressed. Investing isn’t about overreacting to quarterly earnings but about understanding the long-term growth potential of the markets in which the companies you invest in operate. While massive spending on AI may not benefit every firm equally, such spending still generates substantial revenue for vendors like Nvidia and Microsoft. Moreover, major tech firms have demonstrated their capacity to endure setbacks and continue to thrive, as evidenced by the recent performances of Meta, Alphabet, and Netflix.
A Bronze medal for the S&P 500
The 2024 Olympics officially kicked off on July 26, and, as always, the event was surrounded by its share of controversies.
First, arsonists sabotaged the rail network, followed by relentless rain that threatened to turn the opening ceremony into a soggy affair. There were further blunders, such as the Olympic flag being hoisted upside down, South Korean athletes being mistakenly introduced as North Korean on live television, and the uproar over the “Last Supper” and other scenes, which led to an official apology from the organizers.
A spokesperson for Paris 2024 stated, “There was never an intention to show disrespect to a religious group. If people have taken any offense, we are, of course, really sorry.”
To that, I’d add that an apology including the word “if” falls short of being a true apology. Sports, with their numerous health benefits and enjoyment, are best kept free from political controversy.
The Cauldron of the Olympic Games Paris 2024

Source: 2024 IOC
There were plenty of very good bits too – the “mystery torchbearer” running over those slippery rooftops was glorious, as was the majestically hoisted Olympic “ring of fire” torch floating 200 feet high up in the air. It wouldn’t be safe to get a real flame up to 200 feet high, as it would require pipes feeding gas or another combustible to fuel the fire, so it’s not a surprise that the “ring of fire” isn’t actually burning – it’s an illusion made up of clouds of mist and beams of light.
It’s worth noting that the first hot air balloon carrying a human, flew in Paris on November 21, 1783. About a week later, the first manned hydrogen balloon flight, took off from the Jardin des Tuileries in Paris – the same place the Olympic cauldron is today.
Final point- if you’re an organiser and want to host event outside, just presume it will rain.
Turning now to the markets.
By indicating a possible interest rate cut in September, as it did on Wednesday, the US Federal Reserve (Fed), risks becoming entangled in the US presidential election.
A rate cut before the election could attract criticism from Republicans and former President Donald Trump, while delaying a much-needed reduction, might hurt the economy and frustrate Democrats.
With the labour market weakening, inflation approaching +2%, and the Fed aiming to avoid a recession, these are delicate times. These challenging optics will likely push Fed officials to carefully manage expectations and communications over the next few weeks.
This week’s earnings reports from major companies have been significant, with Meta and Microsoft taking centre stage. However, the big report everyone is waiting for is Nvidia (NVDA), scheduled for August 28.
Let’s revisit the market reaction from this Tuesday following Microsoft’s earnings:
- Right after Microsoft announced its earnings, its stock fell over -7% due to Artificial Intelligence (AI) revenue not meeting expectations
- However, when Advanced Micro Devices (AMD) projected increased spending on AI chips, Microsoft’s stock bounced back by+ 5%. Nasdaq futures climbed +1.5%, and NVDA surged about +10% from its after-hours low, to its premarket high, even outperforming AMD, which had just reported positive earnings
“Is the market reacting judiciously?”
More on big tech and the Fed in the Markets and Economy section below.
On the broader market level, July has been a tumultuous month. Despite the ups and downs, the S&P 500 (SPX) has still managed to climb +16% this year. In any given year, a +16% return would be cause for celebration. Yet, with the recent AI led tech stock rally, and overall market gains, expectations have been set higher.
Although the SPX is down -2% from its mid-July peak, it remained positive for the month of July.
The SPX in July therefore only deserves a Bronze medal.
S&P 500 price chart, (Dec 2023 – YTD)
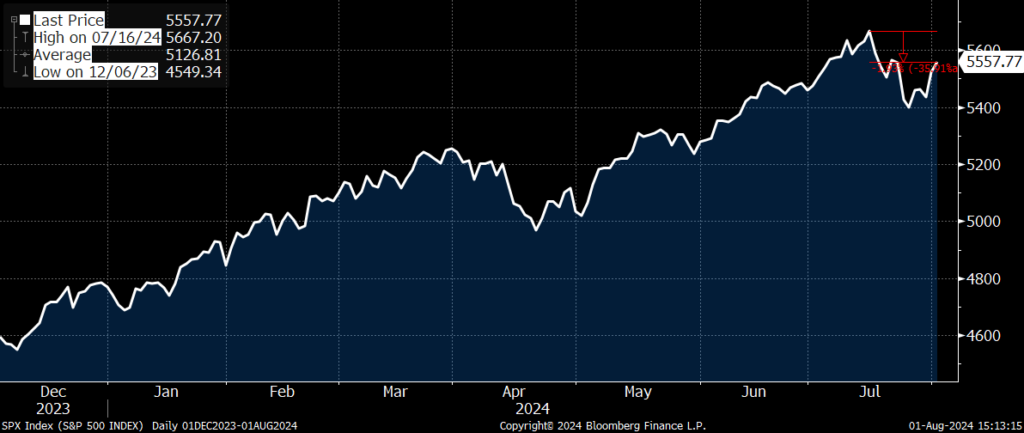
Source: Bloomberg
Encouragingly, despite the market volatility, the “breadth of the market” – the relative number of advances and decline of stocks in the index – is getting better.
The chart below from BespokeInvest, illustrates all days since 1990 when the SPX fell by at least -2%. It compares these declines to each day’s net advance/decline reading – the difference between the number of advancing stocks and declining stocks.
As expected, on days when the SPX dropped by -2% or more, the number of declining stocks generally far exceeded the number of advancers. Typically, on such days, only about 33 stocks finished higher, compared to 465 decliners, resulting in a median net daily advance/decline reading of -432.
However, mid last week’s -2% drop, was an exception to this rule. Despite the SPX ‘s over -2% decline, nearly one third (165) of its components ended the day with gains. This resulted in a daily net advance/decline reading of -171, which is significantly stronger than the historical norm, and ranks as the fifth strongest among all days since 1990, with a -2% drop in the SPX
The most recent comparable instances of strong breadth during such declines were in October and November of 2000. Notably, there was also a day in May 2000 with even better breadth on an over -2% decline, and in April of that year, there were days when the SPX fell by -2% with positive breadth.
This type of price versus breadth action hasn’t been seen since the Dot Com Bubble burst. A rebound in breadth is a positive sign, as recent market gains have been driven primarily by large technology stocks, leaving the rest of the index behind. Increasing breadth indicate, a healthier and more sustainable bull market. Participation in the rally has broadened, particularly among cyclical sectors.
Increasing breadth readings suggest that pullbacks or corrections should be viewed as buying opportunities, as upward momentum often continues over the next few months, just as a narrowing breadth indicates oversold and bottoming market.
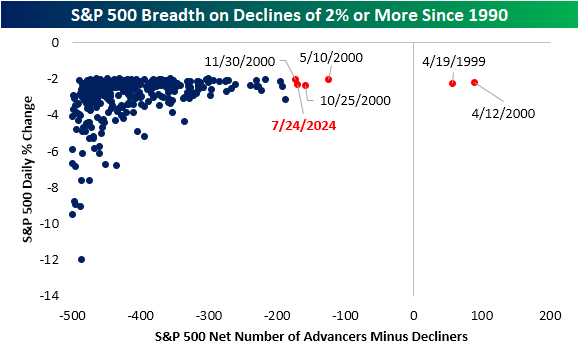
Source: Bespoke Invest
In more positive news for inflation, which could help the SPX outperform its bronze medal status, the New York Fed’ measure of inflation persistence -the Multivariate Core Trend (MCT) rate -declined again in June, reaching +2.1%. This drop is particularly notable due to significant shelter disinflation observed in June. The broad-based declines in inflation are encouraging.
The NY Fed’s MCT model evaluates inflation persistence across seventeen core sectors of the US personal consumption expenditures (PCE) price index. It is crucial for US policymakers to understand whether inflation is transient or persistent, concentrated in a few sectors, or widespread.
The NY Fed’s MCT model evaluates inflation persistence across seventeen core sectors of the US personal consumption expenditures (PCE) price index. It is crucial for US policymakers to understand whether inflation is transient or persistent, concentrated in a few sectors, or widespread.
Key findings for June include:
- The Multivariate Core Trend (MCT) inflation fell to +2.1% in June from +2.4% in May, with a 68% probability band of (+1.6%, +2.6%
- Compared to pre-pandemic levels, housing contributes +0.12% to the MCT estimate, while services excluding housing contribute +0.22%. Core goods had a slight negative impact of -0.06%
- The remaining inflation persistence in housing and services excluding housing is largely driven by sector-specific factors
It can be argued that rate hikes have largely fulfilled their role in moderating inflation, given past supply and demand constraints. Lowering interest rates could enhance sentiment and improve housing affordability.
NY Fed’s Core Trend of US Personal Consumption Expenditures (PCE) price index
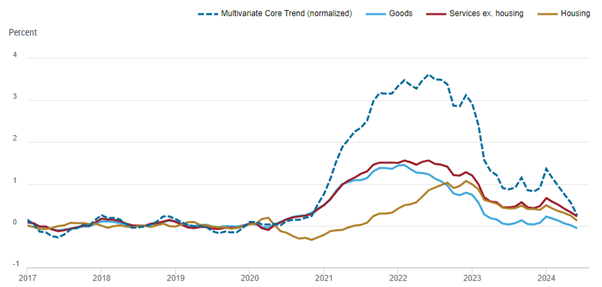
Source: Bureau of Economic Analysis (BEA)
After breaking through the 5,500-support level to the downside last week, the SPX made two unsuccessful attempts to reclaim that key psychological level. This recent bounce won’t be worthy of a gold medal until the SPX can break back above (as it did Wednesday) and hold those levels.
On a brighter note, the SPX briefly fell below 5,400 on two occasions, but each time, buyers quickly stepped in to support the market.
Markets and the Economy
Earlier this year, the likelihood of rate cuts at the Federal Open Market Committee (FOMC) meetings in March, May, June, and July was over 80%. Despite this, no cuts were made at any of these meetings, including the one held just held in July.
However, looking ahead to the upcoming meetings, the markets now almost guarantee a rate cut at each of the next four meetings – Sept, November, December and January 2025.
At the press conference on Wednesday, Fed Chair Jerome Powell, underscored his comfort with the idea of near-term rate cuts, suggesting that a reduction “could be on the table at the September meeting”, and “the reduction of the policy could be as soon as September”, concluding “base case [is]that policy rates would move down from here” and that the policy could be adjusted as early as September.
Rather than contesting market expectations, Powell explicitly supported the September rate cut, thus fuelling the day’s rally. In his economic analysis, Powell focused heavily on the downside risks associated with labour markets and the FOMC’s close attention to labour market trends. He characterized the current economic adjustments as “normalisation”.
The Fed’s next meeting is September 17-18, and the one after that is set to begin the day after the November 5 election.
So, what do the bond yield spreads, often predictors of an oncoming recession, have to say?
Let’s look at the data.
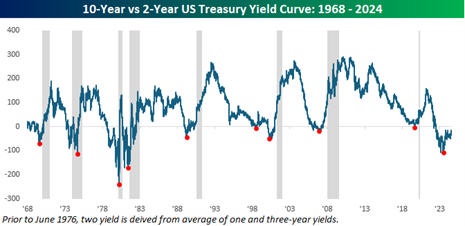
- The spread between the 10-year and 2-year US Treasuries has been negative for just over two years, marking the longest period of inversion on record
- However, since the end of June, the curve has steepened significantly, narrowing from around -50 basis points to -15 basis points this week its least inverted level in over two years
Inverted yield curves are often linked to recessions. The chart below illustrates the 10-year vs. 2-year US Treasury yield curve since 1968.
Historically, recessions (indicated by grey shading) have followed periods of curve inversion, though the timing of the economic downturn could range from a few months to several years after the initial inversion. The red dots highlight the most inverted points during each period of inversion.
While yield curves are generally associated with recessions, a more precise recession indicator is when the yield spread turns positive after being inverted.
We are currently just -23 basis points away from this transition.
Source: Bespoke Invest
While an inverted yield curve returning to a positive slope is often viewed as a stronger recession signal than mere inversion, it’s important to assess the market’s behaviour following this shift before one turns bearish, on account of a possible recession.
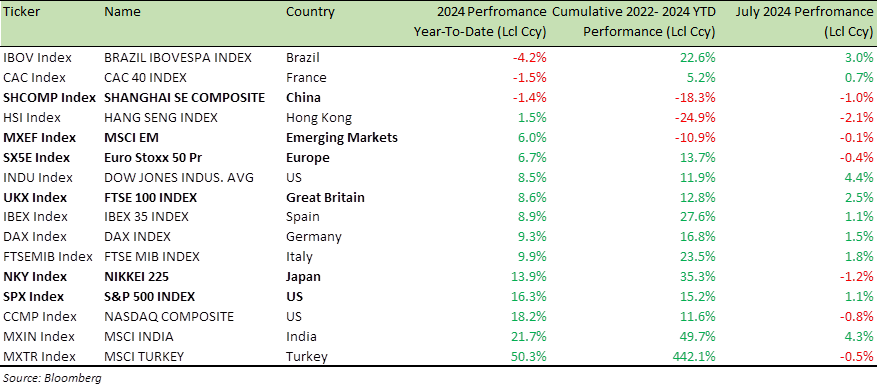
Despite the market volatility in July, the SPX index is still up +16% year-to-date (as shown in the table below), which matches its gain over the past 30 months from December 2022 to the present.
This is because SPX’s performance was flat during the 24 months of 2022 and 2023, but we are now seeing positive returns for this year.
Global Equity Index Performance (2024 YTD, Cumulative 2022-2024 YTD and July 2024)
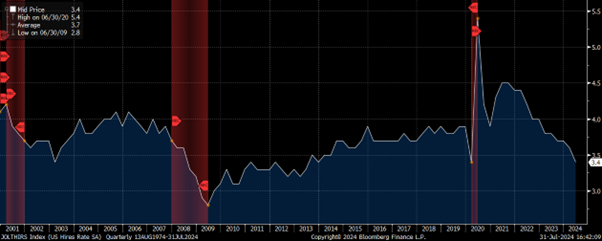
The June US JOLTS (Job Openings and Labor Turnover Survey) report was released on Monday. The Hires rate is beginning to signal potential recessionary trends (chart below with periods of US recession highlighted in red), a scenario the Fed is likely to take all measures to prevent.
- There are currently 1.2 available jobs for each unemployed worker, down from a peak of 2 jobs per unemployed person about 18 months ago
- The job openings rate remained steady at 4.9% in June, with 8.184 million positions available, slightly down from 8.23 million in May. At its peak in Dec. 2020, the job openings numbered 12.2 million
- The hiring rate decreased to 3.4% from 3.6% last month, with 5.341 million new hires. The quits rate has reached a cycle low, suggesting that wage growth may continue to slow in the coming quarters
The ADP Jobs report released this week further confirms the slowdown in the US labour market, showing an addition of just 122,000 jobs—well below the 150,000 expected and down from the 155,000 added in June.
This softening labour market has diminished employees’ bargaining power, leading to smaller wage increases. The 12-month pay growth for individuals remaining in the same job dropped to a three-year low of +4.8% in July. Nela Richardson, ADP’s chief economist, commented, “with wage growth slowing, the labour market is aligning with the Federal Reserve’s efforts to curb inflation.”
This is music to the Fed ears, as the FOMC prepares to embark on a series of rate cuts.
US JOLTS (Job Openings and Labor Turnover Survey) report: Hires Rate SA
Source: Bloomberg
Continuing from our discussion on big tech:
Earlier this week, Microsoft reported a notable +15% increase in overall revenue, with Azure cloud revenue rising by +29%. Despite these impressive figures, the stock saw a sell-off, which might be attributed to overenthusiasm from investors and analysts.
- A critical detail to note is Microsoft’s capital expenditure, which reached $19 billion last quarter—up +78% year-on-year and equivalent to what the company spent in an entire year just five years ago
- Microsoft closed the fiscal year with a record $109 billion in operating income. That’s $2 billion per week
- The company achieved an annual operating margin of 44.6%, a level not seen in over two decades
- On its earnings call, Microsoft projected another year of double-digit growth in both revenue and operating income for fiscal 2025
CFO Amy Hood stated, “To meet the growing demand for our AI and Cloud products, we will scale our infrastructure investments, with FY25 capital expenditures expected to exceed FY24.”
This suggests that those anticipating a slowdown in AI spending impacting Microsoft or Nvidia might be in for a surprise.
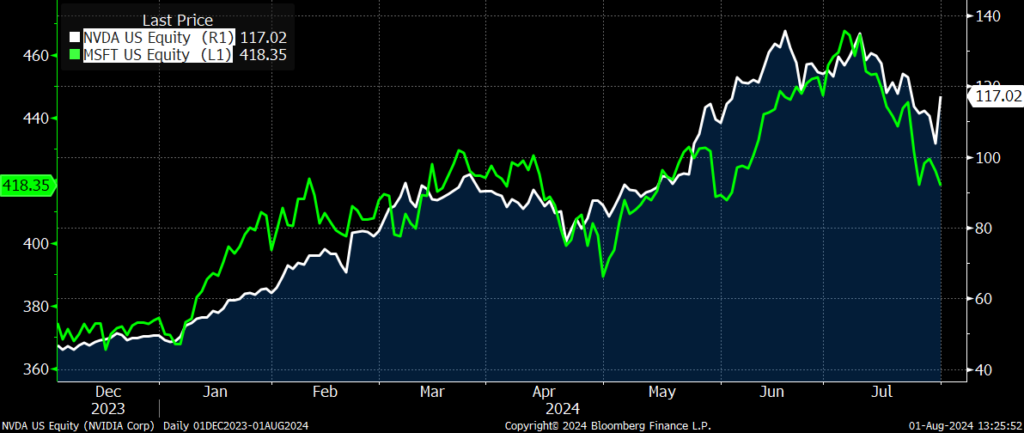
Nvidia, which sold off –25% and is now -13% from its recent high, seems to be a bargain at current levels and is likely to rebound toward its peak following Q2 results at the end of August.
6-month price chart: Nvidia (NVDA) and Microsoft (MSFT)
Source: Bloomberg
Those predicting a slowdown in AI spending may find themselves writing about missed opportunities in 2034, if they didn’t invest or hold on to MSFT, NVDA, AMD, Broadcom, Amazon etc. in 2024.
Investing isn’t about overreacting to quarterly earnings but about understanding the long-term growth potential of the markets in which the companies you invest in operate. While massive spending on AI may not benefit every firm equally much like not every child becomes a piano prodigy despite excessive sums spent on tutoring such spending still generates substantial revenue for vendors like NVDA, MSFT.
Moreover, big tech companies have the resilience to weather mistakes and continue thriving just look at Meta, Alphabet, and Netflix more recently.
Investing in large-cap companies with established revenue potential offers greater stability than chasing smaller, emerging opportunities. Microsoft and other tech giants possess the resources to outlast or acquire competitors, much like the auto manufacturers did in the 1920s.
Market volatility and drawdowns are not anomalies but rather inherent features of investing and should be anticipated, embraced and strategically addressed. Predicting short-term market movements can be extremely challenging. Hence, I highlight the value of equity structured products as a highly effective investment tool to manage and potentially capitalize on increased market volatility.
These products offer a degree of capital protection while helping to identify advantageous entry points. They also present opportunities to generate returns, even in flat or declining market conditions.
For specific stock recommendations and insights related to structured products, please don’t hesitate to reach out to me or your dedicated relationship manager.
Best wishes,

Manish Singh, CFA