

The S&P 500 advanced +8.92% during November, putting in its best monthly showing in 18 months. The rally also extended to bonds, as yields continued to fall. What next?
Summary
November has been a great month for risk. For over 5 weeks now, the US stock market, along with most other asset classes, has been on a rally. The S&P 500 advanced +8.92% during November, putting in its best monthly showing in 18 months. The rally also extended to bonds, as yields continued to fall. It seems, nobody is taking seriously Federal Reserve Chair Jerome Powell’s warning that it’s “premature” to start talking about interest rate cuts.
The S&P 500 is now -5% from its all time high of January 3, 2022, and its total return index (which takes into account dividends) is merely -1.1% away from its previous all-time high.
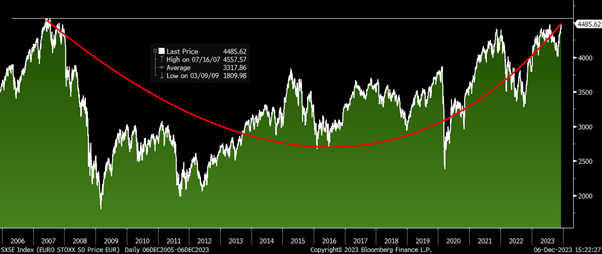
Meanwhile in Europe, the EuroStoxx 50 has hit a 52-week high, and is inching close to its all-time high of July 2007.
Looking ahead to 2024, one theme that stands out to me is the influence of Chinese Apps on US and European consumers as well as the price dynamics.
Chinese companies that have thrived and beaten competition in a market of 1.4 billion people, often find it comparatively easier to outpace competitors in European markets with considerably smaller populations of 30- 50 million. While cultural disparities exist, the universal truth remains: Low price combined with high quality, equals an increased market share. This dynamic is already evident in the automotive manufacturing industry where Chinese cars are competing strongly on both pricing and quality.
At this point last year, as I peered into the upcoming year and put down my end of year target for the S&P 500, I had anticipated a +12% increase for the index in 2023. However, we’re currently on a trajectory for a +20% increase for the year. Glancing forward to next year, even if there is to be a recession in the US (which I believe will be a mild one), I forecast the S&P 500 surpassing 5,000 by the close of 2024, indicating a +10% rise.
An early Santa Claus rally; disinflation in 2024 (and beyond)
The holiday season is almost upon us and it’s good to see a consistent sea of green on Bloomberg screens over the last few weeks.
Very soon, it will be high season for holiday shopping. My rule for holiday shopping is – wait until January. Sadly, it never works.
My two kids have kicked off the festive season by penning letters to Santa and crafting lists of their desired gifts. I can handle that much. What gets me a bit flustered, though, is the recent tradition of “elf on the shelf.”
If your kids have outgrown this tradition or aren’t interested in the whole “elf on the shelf” affair, count yourself lucky and feel free to skip ahead to the equity market discussion below.
For the uninitiated, the elf on the shelf is a toy elf that keeps a watchful eye on children’s behaviour, reporting back to Santa every night from its perch on the shelf. Each morning, it magically relocates to a new spot in the house, and the kids eagerly search for its new position.
One nerve-wracking incident this week had me jolt awake at 4 am—I had forgotten to move the elf before calling it a night.
Already guilty of a similar slip-up, I had already used the “bad weather hindered the elf’s journey back to the North Pole” excuse. I can’t use that one again! Well, the great British weather might excuse it, but I’d rather not raise any doubts, if you catch my drift.
Those that have promoted this practise seem to believe it’s good way to keep kids in line during the holiday season. I say to them – I too had something like this watching my behaviour and keeping me in line when I was a kid. I called him Dad.
Anyway, back to the markets!
The yield on the benchmark 10-year US Treasury bond is now at +4.1% (chart below), down from +5% – its highest yield since 2007 – only one month ago.
US Yield curve from 1 month to 30 years: Current and 2 months ago
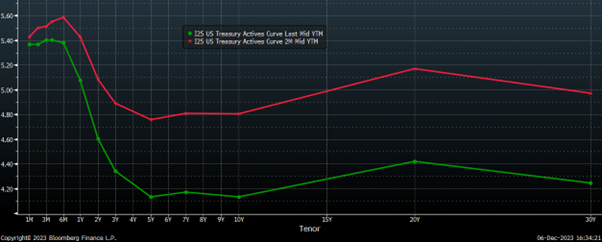
Source: Bloomberg
The sharp rally in the bond market is fuelled by the growing anticipation of forthcoming US interest rate reductions in 2024. Currently, US interest-rate futures are indicating an approximate 125 basis points (where 100 basis points equal 1%) decrease in fed fund rates for the upcoming year.
The 2-year yield, which typically mirrors shorter-term interest rate projections most closely, continued its decline, hitting +4.5% earlier this week, down from its peak of +5.25%, six weeks ago. Despite the US Federal Reserve (Fed) having increased its federal funds rate by 525 bps since March 2022, it has abstained from raising rates in three out of its past four meetings.
There is no expectation for a rate hike at its meeting scheduled for December 13 next week.
On November 28, Fed Governor Christopher Waller said that if inflation continues to decline in the coming months, the Fed will likely start cutting rates. “There is no reason to say we will keep it really high,” Waller said during an event at the American Enterprise Institute.
November has been a great month for risk. For over 5 weeks now, the stock market, along with most other asset classes, has been on a rally.
The S&P 500 (SPX) advanced +8.92% during November, putting in its best monthly showing in 18 months. The only other stronger months since the COVID pandemic, were April 2020 and November 2020. The rally also extended to bonds, as yields continued to fall. It seems, nobody is taking seriously Fed Chair Jerome Powell’s warning that it’s “premature” to start talking about rate cuts.
The SPX is now -5% from its all time high of January 3, 2022. However, if you take into account dividends, the SPX total return index, is almost at the brink of setting new record highs. The total return index is merely -1.1% away from its previous all-time high.
Moreover, the SPX pattern closely resembles a cup and handle (see chart below), a configuration that technical analysts view as a bullish indicator.
New highs in 2024? Well, wouldn’t that be welcome after a gap of 2 years!
S&P 500 Total Return Index (SPXT): 5-Year price chart
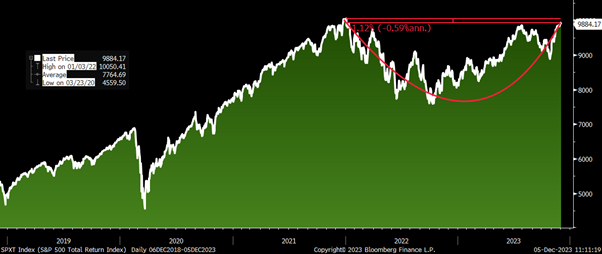
Source: Bloomberg
Looking ahead to 2024, one theme that stands out to me is the influence of Chinese Apps on US and European consumers, as well as the price dynamics.
If you’ve followed the development of the Chinese economy over the last three decades, then you’ll know that what happens in China doesn’t always stay in China. China has a long history of upending trends.
A prime example is when China unilaterally devalued its currency from 5.8 RMB/USD to 8.7 RMB/USD. This decision largely flew under the radar for many investors due to China’s limited global economic influence at the time. Currency devaluations don’t swiftly affect economies; it takes time for supply chains to adjust, and corporations typically hedge their foreign exchange exposure for several years. The impact of China’s devaluation in late 1994, took three years to impact its trade rivals. Subsequently, in 1997, the Thai Baht was forced to devalue, setting off a series of events that led to the Asian financial crisis, leaving a lasting impact on those who witnessed it firsthand.
Last week, I was on CNBC to discuss PDD Holding’s (PDD – principally agriculture focused commerce platform in China and the now uber-popular e-commerce platform Temu in North America) earnings, and China consumer stocks. Here’s a short clip from that interview
Notably, Chinese e-commerce entities have gained substantial traction in China (Covid-19 accelerated the e-commerce trend in China) and they are now expanding vigorously in the US and Europe.
It’s a great time for Chinese apps, as both Western and Chinese consumers share a common desire for seeking attractive “bargains” when making purchase. While the Western consumers grapple with the ongoing “cost of living” crisis, Chinese consumers face a decline in “property wealth,” due to China’s economic shift away from property-driven growth.
Chinese companies that have thrived and beaten competition in a market of 1.4 billion people, often find it comparatively easier to outpace competitors in European markets with considerably smaller populations of 30- 50 million. While cultural disparities exist, the universal truth remains: Low price combined with high quality equals an increased market share.
This dynamic is already evident in the automotive manufacturing industry where Chinese cars, competing strongly on both pricing and quality, are challenging and surpassing esteemed German manufacturers, leaving them struggling to keep up.
Chinese manufacturers who have been selling on platforms such as Tmall, Shein, or Pinduoduo (PDD) have a significant background in producing goods for foreign brands. These sellers are now venturing into establishing their own brands. This transformation is motivated by a desire for autonomy and the promise of higher profitability.
Back in 1994, China’s GDP was one-third the size of the US. However, today, China’s economy has grown to be as substantial as, if not larger than, that of the US, especially on a purchasing power parity (PPP) basis. Consequently, China’s influence on the rest of the world has become more rapid and significant.
Temu, PDD’s overseas initiative launched in the US in September 2022 and is now available in 48 countries, including across Europe and the Middle East, as well as South East Asia and Australia.
Much like during China’s rise to manufacturing dominance over two decades ago, China’s prowess in the App-driven economy, leveraging its vast internet user base for testing preferences and optimizing AI models, is poised to disrupt daily consumer goods markets globally. They’re also getting smarter and learning from challenges faced by Chinese companies in the West. Both Shein and Temu have sought to avoid the kind of scrutiny TikTok has come under by attempting to mark a distance from their Chinese roots. In 2021, Shein changed its parent company from a Hong Kong-registered firm to a Singapore-incorporated entity. Temu is based in Boston and runs its U.S. business through a Delaware-based company.
In a nutshell – more choice, and lower prices for consumers in US and Europe.
China’s hard working culture that values math and science, is far outpacing the western world and helping China develop better apps. Meanwhile, the West is busy glorifying wealth through celebrities, and kids aspiring to become “social influencers,” entertainers, or sports stars, evident in the exorbitant salaries paid in these fields. Even an assistant football coach at a US university can command a multi-million dollar salary. The diligence and dedication to quality education that propelled the US and the West to their peak, have lost momentum. This drive has shifted towards nations – China and India in particular, that still champion hard work, scientific education, and perseverance.
The transformation initiated by Chinese manufacturers selling on Amazon post the 2008 financial crisis has evolved, bringing Chinese companies directly into Western households through their Amazon-like platforms. The evolving landscape of Chinese consumer apps demands close attention for potential impacts on the Western market in the years ahead.
Markets and the Economy
With inflation back on target in the short term, economic data looking unimpressive, and very weak foreign conditions in China and Europe, the Fed Funds Rate is looking increasingly tight, relative to what the US economy needs.
Chair Powell’s exhortation this week that “it is premature….to speculate on when policy might ease,” seems to have fallen on deaf ears as the market is correctly betting on interest rates have gone from easy to too tight.
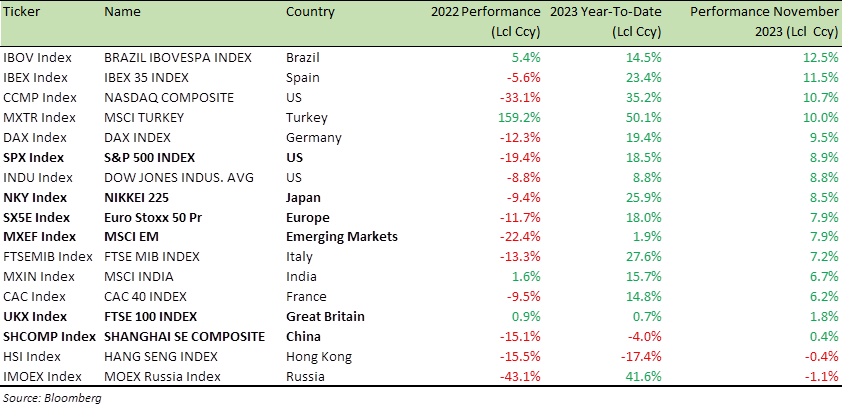
As a result, over recent weeks, we have seen a robust rally in equities across the globe (see chart below).
The SPX is on track for a +20% year.
While most equity markets have performed well this year, there have been exceptions, particularly in China and the Emerging Market index, where China holds significant weight.
Benchmark Global Equity Index Performance (2022; 2023 YTD and November 2023)
In 2024, closely monitoring the US labour market will be crucial, given that a key hallmark of a recession, involves a decline in overall payrolls and an increase in the unemployment rate.
Throughout 2023, US payrolls continued to expand, although at a slower pace compared to 2022.
In 2022, job growth stood at a robust 410,000 per month. During the initial half of this year, job growth averaged 250,000 per month, while over the latter six months, the rate dropped to 180,000 per month i.e. a slowing trend.
Furthermore, we are seeing the first signs of a growing slowdown in the jobs market. The US job openings as measured by US Job Openings and Labor Turnover Survey (JOLTS), fell to their lowest level in more than two-and-a-half years in October. Business advertisements for job vacancies dropped from 9.6 million in September to 8.7 million in October, below the consensus forecast of 9.3 million. Job openings serve as a reliable gauge of labour demand.
Chairman Powell often references the ratio of job openings to unemployed workers, as a favoured metric for assessing labour market tightness. This ratio had previously reached as high as 2.0 (two openings per unemployed person) but has now retreated to 1.34, nearing the pre-pandemic range of 1.2 to 1.25, and declining rapidly.
Interestingly, the JOLTS data appears to be closely linked to movements in the SPX. Where JOLTS trends, the SPX tends to follow (see chart below). However, a rate cut could potentially alter this trajectory entirely.
US Job Openings and Labor Turnover Survey (JOLTS) and S&P 500 – 20 Year Price chart

Source: Bloomberg
Meanwhile in Europe, the EuroStoxx 50 (SX5E) has hit a 52-week high and is inching close to its all-time high of July 2007. Despite a rapid rise in short-term interest rates by 450 basis points in 14 months, from -0.5% in June 2022 to +4.0% in September this year, both the SX5E and the German equity benchmark DAX have shown substantial gains.
The DAX has soared +12.6% in last 6 weeks alone.
In 2023, Europe experienced a mixed bag – averting an energy crisis over the winter, but facing disappointing GDP growth since the spring. Consequently, private consumption remained subdued, while investment continued relatively strong.
November saw a decline in inflation in the Eurozone to +2.4%, down from 2.9% the previous month, edging closer to the ECB’s 2% inflation target, and all but confirming that the ECB’s rate hiking cycle is over. Among the EU bloc’s largest economies, annual inflation fell in Germany to +2.3%, France to +3.8%, Italy to +0.7% and Spain to +3.2%, according to EU-harmonized data. A rate cut in the Eurozone looms.
With wage growth in the Eurozone now outpacing prices, consumers’ purchasing power is set to be enhanced. The combination of increased consumer spending power and a potential rate cut, could provide further upward momentum for the SX5E.
If you ever saw a “cup and handle” bullish chart then this has to be it. A rather deep cup you may say, which has been 18 years in the making.
EuroStoxx 50: 20-year price chart
Source: Bloomberg
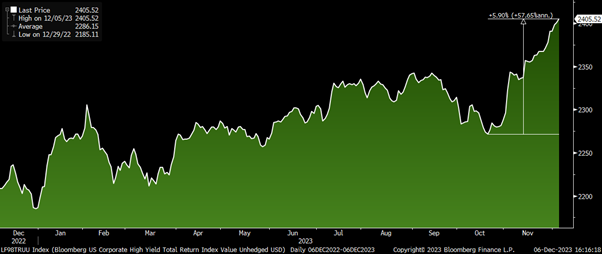
Over the past six weeks, prices of high yield bonds have surged, driven by a combination of declining rates and reduced spreads. The US high yield index has risen by +6% during this period (see chart below)
While yields for European high yield bonds, still exceed the levels observed at the height of the bull market, they have trended downwards in 2023. September saw yields around +7%, a notable decline of about +3% from the elevated levels at the close of 2022.
Further boosting confidence among investors in high yield assets was a recent adjustment in US GDP data, revealing slower inflation than initially estimated for the third quarter. The revision downward by -0.1% in the Personal Consumption Expenditure (PCE) price index, which the Fed favours as its inflation gauge, now stands at +2.8%.
With inflation in check, the Fed has more flexibility to react to growing risks in GDP growth, potentially allowing for rate cuts without concerns of fuelling inflation. The focus has now shifted to the timing and scale of these cuts rather than debating their possibility, let alone the risk of hikes. This positive outlook bodes well for high yield bonds.
While the US and European high yield markets have experienced optimism, the Asia-Pacific region hasn’t mirrored this positivity. The ongoing crisis in the Chinese real estate sector, historically a key driver of high yield activity in the region, has significantly impacted high yield issuance across the Asia-Pacific.
The Bloomberg US Corporate High Yield Bond Index: 1 Year price chart
Source: Bloomberg
In last December’s Market Viewpoints, as I looked forward to 2023, I emphasized the importance of focusing on the medium term to navigate through short-term volatility
I wrote:
“A focus on the medium term will spare you the anxiety of short-term volatility. In this sell-off, the SPX bottomed at 3600 in June [2022] and here we are end of the year, with the SPX at 4,000. Central banks can change the narrative without any warning. It can lead to a shallower recession (or a recession avoided). If you turn bullish when everyone else is bullish, then you are buying late in the cycle. There is an opportunity cost to it which accumulates over time. Instead, I recommend you focus on market internals and invest in tranches over time. My end-of-2023 target for the SPX is 4,290.”
I was expecting 2023 to be a +12% year for the SPX. Instead, we are on track to have a +20% year, with the SPX currently at 4565.
So, what’s my target for the SPX for next year, you ask ?
Looking ahead to next year, even in the scenario of a US recession, I anticipate the SPX to reach over 5,000 by the end of 2024, marking a +10% year.
As this year comes to a close, I’d like to express my gratitude for your time and attention.
Wishing you and your loved ones a joyous holiday season and a Happy New Year. For those celebrating Christmas, I hope it’s a fantastic one filled with warmth and happiness.
Best wishes,

Manish Singh, CFA