


“Inflation in the US is now back to the Fed’s target, Europe now boasts its own “magnificent five” – SAP, ASML, Siemens, LVMH, Total Energies”
Summary
US consumers were expected to roll over, but they have remained resilient and continue to spend. A year ago, consensus estimates strongly predicted a recession in 2023, forecasting meager +0.2% growth for the year. However, the actual outcome defied these projections, with the US economy expanding at +3.1% in 2023, more than four times faster than the +0.7% growth observed the previous year.
Supply expansion leading to price increases is more permanent than when it is driven by demand contraction because demand can rebound, and if supply doesn’t improve, prices can rise again. This is unlike what occurred in 1976, as the current situation sees supply increasing and prices falling. Inflation in the US is now back to the Fed’s target, and Fed Chair Jerome Powell and his team deserve credit for achieving this. The stage is set for the Federal Reserve to proceed with a 25-basis points rate cut at its March 20 meeting.
For an extended period, the European economy and equities have trailed their counterparts in the US. However, there are signs of a potential shift. Over the last five months, the Euro Stoxx 50 index has displayed significant momentum, with both the S&P 500 and Euro Stoxx 50 posting comparable gains.
The Euro Stoxx 50 is no longer weighed down by underperforming telecom and financial stocks; instead, growth sectors like technology and luxury now make up 20% of the index. Europe now boasts its own “magnificent five” – SAP, ASML, Siemens, LVMH, Total Energies – and these stocks have strong tailwinds due to their leadership positions in their respective sectors.
Returning to target inflation, and “Good news” is once again good news!
Contrary to expectations, the highly anticipated recession in the United States failed to materialize in 2023, and instead, the US economy exhibited robust growth, achieving a remarkable +3.1% expansion over the span of 12 months. A year prior, consensus estimates had strongly indicated an impending recession, projecting a meagre +0.2% growth for the year. However, the actual outcome defied these predictions, with the US economy surging at a pace more than four times faster than the +0.7% growth observed in 2022.
In the final quarter of 2023, the US Gross Domestic Product (GDP) exhibited an impressive +3.3% annual growth rate, surpassing the expected +2.0% rate and the +2.4% forecast by the Atlanta Fed’s GDPNow tracker, widely regarded as the gold standard for real-time GDP tracking. Instead of seeing a downturn in consumer spending, US consumers remained steadfast and continued to spend.
Arguably, one of the most noteworthy highlights from the recent quarterly National Income and Product Accounts (NIPA) data release is the core Personal Consumption Expenditure (PCE) prices, which saw a consecutive +2.0% quarter-over-quarter seasonally adjusted annual rate (QoQ SAAR) increase for the second time. Essentially, the quarterly GDP data, subject to potential revisions, demonstrates an almost precision-like return to target inflation, as illustrated in the chart below.
While US GDP maintains its growth trajectory, core inflation in the United States, as measured by the Personal Consumption Expenditure (PCE) index, is achieving the desired +2% growth rate.
US Core PCE back to +2% target.. for two straight quarters
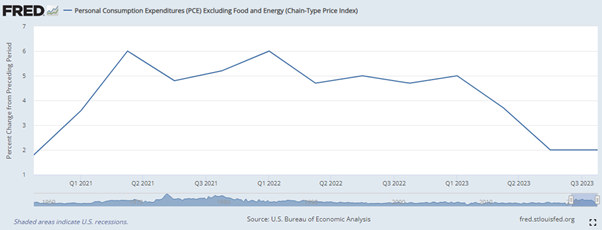
A year ago, these numbers looked scary. Core PCE increased by +5.0% in Q1 and +3.7% in Q2.
Using the month-on-month data,
on a 3-month basis, core PCE is +1.52% p.a.
on a 6-month basis, core PCE is +1.86% p.a.
While some still fret about the potential resurgence of inflation, the chart below from the New York-based Roosevelt Institute, provides a compelling and optimistic perspective.
At a fundamental level, there are typically two primary explanations for the potential decline in price levels, which is synonymous with a decrease in inflation. The first involves expanding “supply,” while the second entails reducing “demand.”
In the scenario where demand is dwindling while supply is on the rise, it inherently sets the stage for a hastened decline in prices, potentially initiating a sequence starting with disinflation and ultimately progressing towards deflation.
- In 2023, 71 percent of the weighted deceleration in prices was observed in categories where the quantity expanded, indicating a supply expansion
- In contrast, back in 1976, 68 percent of the deceleration in prices occurred in categories where quantities were declining, signifying a decrease in demand
- Supply expansion that leads to declaration in prices is more permanent than the one that is led by demand contraction as demand can come back again and if supply hasn’t improved, prices can start rising again. This is what happened in 1976 and isn’t happening now.
This time around it’s – supply is increasing, and prices are falling.
Price Indices for Personal Consumption Expenditures (PCE) by supply and demand of product
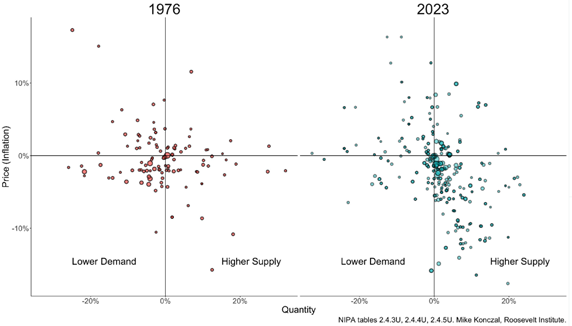
Source: Mike Konczal, Roosevelt Institute, New York
The noteworthy driver of disinflation is the substantial increase in supply, a phenomenon that is particularly pronounced in the core goods sector (with 87% of it attributed to supply expansion, according to research conducted by the Roosevelt Institute). This trend aligns with expectations, considering the growing accessibility of crucial raw materials, the opening of supply chains, and the expansion of semiconductor production.
Furthermore, when we examine recent GDP figures and reflect on historical data, as illustrated in the chart below, it becomes evident that inflation reached its peak during periods of negative GDP growth in Q1-Q2 2022. However, in the last two quarters, inflation has returned to its target levels, coinciding with a surge in economic growth.
The divergence between output growth and the price level, characterized by falling prices and rising growth, serves as a classic indicator of dynamic supply curves. It also provides a promising outlook for future price levels.
US GDP growth and Personal Consumption Expenditure (PCE)
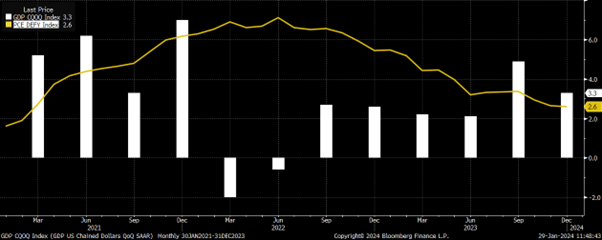
Source: Bloomberg
Over the past week, we have observed a series of positive data points: robust GDP growth in Q4 2023, a US Manufacturing PMI at an 18-month high, an impressive 8% surge in new home sales in December, a seven-month high for US services PMI, an eighteen-month high for US consumer sentiment, and the S&P 500 (SPX) setting a record for the fifth consecutive day.
Historically, a flurry of positive developments in data often triggered concerns about potential monetary policy tightening, leading to market selloffs. However, it seems that this trend has shifted, and “good news” is once again being perceived as just that—good news. Let us hope that this trend continues.
The fabled “soft landing” is still on, as I wrote in the September Market Viewpoints, is still on track.
Few other data worth highlighting from the NIPA release.
- Firstly, there has been a recent deceleration in research and development (R&D) investment. After experiencing significant growth in 2019 and 2020, R&D has stabilized, accounting for approximately 3.5% of the Gross Domestic Product (GDP)
- Secondly, while investment in fundamental research has decelerated, the private sector is actively increasing its investment in the construction of manufacturing facilities. The investment in structures for the manufacturing industry is at its highest share of output in over four decades and continues to rise
- On the consumption front, Americans are gradually reversing the pandemic-induced trend of heightened spending on durable goods. The surge in this spending category during the COVID shock, driven by limitations on service purchases, is gradually diminishing. This should have an easing effect on inflation as prices of durable goods are likely to fall further
- Lastly, it is noteworthy that inventories remain considerably low in comparison to sales on a real basis. This indicates that there is potential for inventory restocking to act as a positive force for GDP growth in the next few quarters
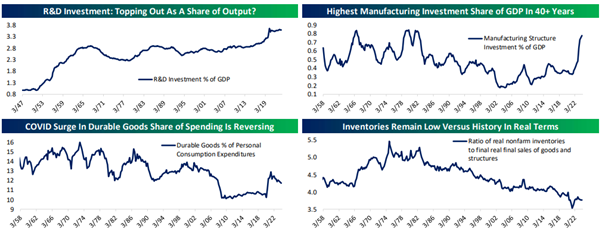
Source: Bespoke Invest
In 2023, we witnessed a remarkable shift towards disinflation following a period of temporary inflation. Throughout this period, economic growth maintained its vigour, labour markets remained robust, and inflation regressed to its targeted levels.
However, it’s essential to note that despite the tightening measures and the deceleration in inflation implemented by the US Federal Reserve (Fed), the bedrock of strong economic growth has endured. In all fairness, the United States has effectively returned inflation to the Fed’s intended target, a commendable achievement attributed to Fed Chair Jerome Powell and his dedicated team.
Now, you might wonder why the Fed has not embarked on a path of interest rate reduction. In my analysis, their approach is rooted in pragmatism, stemming from the fact that the economy continues to exhibit resilience.
In 2021, the Federal Reserve chose to overlook significant price hikes in goods markets, and this approach has persisted into the latter half of 2023, even as they are now disregarding notable price declines, especially in the goods sector. Instead, their attention is focused on the services sector, where concerns regarding sustained inflation persist.
Fortunately, there have been discernible shifts in supply dynamics within the services industry as well. As highlighted in the earlier mentioned Roosevelt Institute report, a substantial 66 percent of the reduction in services inflation can be attributed to increased quantities. This development, in my perspective, brings encouraging news and lays the foundation for the Federal Reserve to consider a 25-basis point interest rate cut at its upcoming meeting on March 20.
Markets and the Economy
The past year has been marked by a whirlwind of activities, ranging from challenges in the banking sector and adaptive monetary policies to breakthroughs in AI, widespread labour strikes, and geopolitical tensions.
In the final two months of 2023, we witnessed a remarkable shift in risk assets as the “higher for longer” perspective gave way, and interest rate cuts were factored in.
Commencing at 3824, the SPX experienced a mid-year slump but rebounded with vigour, concluding the year at 4769, marking an impressive annual increase of +24%.
For the SPX, nearly 60% of the annual return in 2023 came during the last two months of the year. Other indices followed a similar pattern (see the table below).
Benchmark Global Equity Index Performance (2023; 2024 YTD and November-December 2023)
Following the US Presidential elections in November, the president-elect takes office on January 20 of the subsequent year.
Currently, we are in an election year, and the 2024 Presidential Election is rapidly approaching. At this juncture, it appears to be a rematch of the 2020 contest, with President Joe Biden now the incumbent.
While there is speculation about whether Biden will be the candidate, let’s set that aside for now and focus on what an election year typically means for the markets.
Below is a summary of the performance of the SPX during Presidential election years since World War II:
Throughout these years, the SPX has generally traded somewhat flat in the first quarter, followed by a rally until the end of the summer. This rally tends to decelerate in the immediate lead-up to the election in November. However, the consolidation is often compensated for in the final months of the year, resulting in the index finishing with an average gain of +6.8% for the year.

Source: Bespoke Invest
When breaking down market performance based on the incumbent President’s party, periods when a Democrat is in charge, like the current one, have tended towards stronger results, with an average gain of +10.1% by the end of the year.
In contrast, years with a Republican incumbent administration have shown an average gain of +3.9 However, there is an important caveat here.
There was a significant -38.5% decline during George W. Bush’s second term when the SPX fell amidst the Global Financial Crisis (GFC) in 2008. An outlier data point in statistics speak.
When excluding this outlier data from Bush II’s second term, the Republican average full-year gain of +8.66% narrows the gap significantly with the previously mentioned Democrat average of +10.1%.
In other words, election years end up with good returns. Let’s see what 2024 will bring!
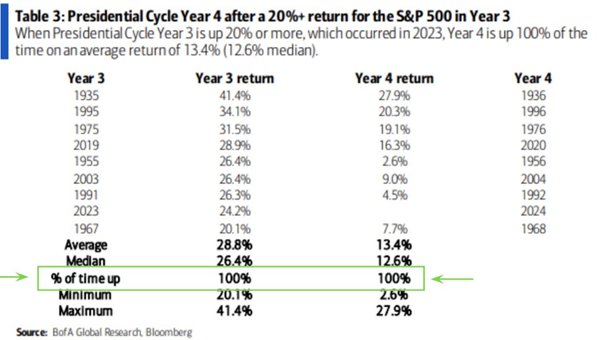
And if you need more convincing then consider this stat – the SPX has never been negative in the fourth year of the Presidential cycle following a +20% gain in a pre-election year. Notably, we had a +24.3% gain last year (see table below).
Moving on to Europe.
It’s no secret that the European economy and equities have lagged their counterparts in the US, and the data supports this observation.
Over the past decade:
- US GDP has expanded by a robust +60%, whereas the Euro area has seen a more modest growth of +15%
- On a price return basis during the same period, the SPX has surged by +175%, while the Euro area’s flagship index, Euro Stoxx 50 (SX5E), has experienced a more modest increase of +54%
However, there are signs of a potential shift. In the last five months, the Euro Stoxx 50 index has shown significant momentum, with both indices posting comparable gains.
In the recent week, the Euro Stoxx 50 index recorded an impressive +4.2% surge, achieving its highest closing since February 2001, although it remains -15% below its peak in March 2000.
- In April 2021, the 12-month forward price-to-earnings (P/E) ratio was at 18.4x. Subsequently, the P/E multiples have decreased to 13x, while the price level has risen by +20%. This suggests that the recent rally has been propelled by robust earnings growth, signalling potential continued strength in the future
- With a forward P/E of 13x, the Euro Stoxx 50 remains relatively inexpensive, trading at a -33% discount to the SPX
Also, it is worth noting the transformation in the composition of the index that is driving the rally.
In 2000, before the dotcom bubble burst, the top 3 stocks were Deutsche Telecom (10.8%), Nokia (9.8%), and France Telecom (7.2%), accounting for 28% of the index.
Over the past decade and beyond, the dominance of telecom and banks as top constituents by weight has impeded the performance of the Euro Stoxx 50. However, today, the top 3 stocks are ASML (10%), LVMH (6%), and SAP (5%), reflecting a dramatic shift with dominance of growth sectors – technology and luxury, now constituting over 20% of the index. This shift strategically positions the index to continue to capitalize on growth opportunities in sectors anticipated to demonstrate resilience, sustained growth, and more favourable valuations.
ASML, the global leader in lithography machine needed to manufacture semiconductor chips and LVMH, the world’s biggest luxury group and owner of brands including Louis Vuitton, Christian Dior, Tiffany etc. alone have contributed almost a third of the index’s overall return since post financial crisis bottom of March 2009 (with ASML entering the index only in 2012). Over this period, ASML’s market capitalization has surged from €6 billion to €320 billion, and LVMH’s has risen from €40 billion to €778 billion This underscores the significant impact and growth of these key players in shaping the performance of the Euro area index.
Since the bottom in March 2009, over half the gains in the index can be attributed to just five key names: ASML, LVMH, SAP, Siemens, and Total Energies.
Europe now has its own “magnificent five” – SAP, ASML, Siemens, LVMH, Total Energies and these stocks have great tailwinds thanks to their leadership positions in their respective sectors.
Euro Stoxx 50 (SX5E Index) price chart and forward price/earnings (P/E)
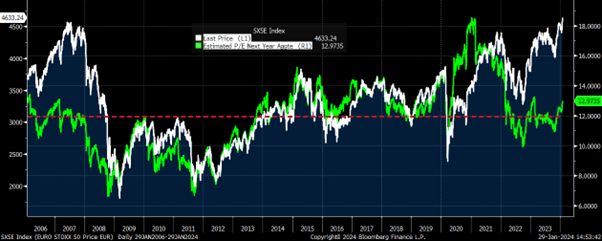
Source: Bloomberg
The European Central Bank (ECB) is expected to make its next move by implementing a rate cut, with April being the more likely timeframe, as inflation is showing improvement. With impending rate cuts on the horizon and a well-balanced index featuring the “magnificent five” on the rise, the SX5E holds promising potential for further upward movement. It is positioned to continue its ascent and potentially reach its all-time high level of 5464, achieved on March 6, 2000.
Current trends suggest that investors are anticipating a significant easing of Fed policies, with six to seven rate cuts expected, aiming for a mid-3% Fed Funds Rate by year-end. This outlook is more dovish compared to the Fed’s own projection of three rate cuts. Investors seem to be anticipating a milder approach.
Historical data sheds light on how aggressive recent tightening measures have been, with the Real Fed Funds Rate currently at +2.4%, significantly above the historical average of +0.89%. The Fed’s mission to curb inflation to +2% is closely linked to stabilizing the labour market, and this strategy is showing signs of effectiveness. US job openings, as measured by JOLTS data, have decreased by over +25% from their peak, indicating a shift towards the Fed’s objectives.
If the SPX continues to align with historical election cycle patterns, we are likely to witness the continuation of a bull market that is still in its growth phase, without any signs of a mid-life crisis.
- Historical Context: Comparatively, in the post-WWII era, only a few bull markets have been shorter than our current run, which is not yet ready for historical benchmarks. The current bull market began in October 2022. To surpass the duration of the next shortest bull market (March 2020 – Jan 2022), this one would need to persist until at least the end of July 2024.
- Growth Comparison: Despite only rising by +36% up to January 2024, this bull market’s growth is considered modest. Nevertheless, if it endures, it could outperform those that were both shorter and less robust.
- Looking to the Median: Post-WWII, the median bull market experienced a surge of +83.1% over 1,418 days. If we apply these medians to the current bull run, we could anticipate an SPX target of approximately 6,700 by late May 2026.
Market volatility is a regular feature and should be expected. Short-term predictions for market movements can be notably challenging. However, over the long term, markets often follow predictable patterns. This is due to the fact that a more extended holding period increases the likelihood of capturing the full market cycle.
The chart below emphasizes this point, demonstrating that the longer your holding period, the more advantageous your position becomes. A long-term investment horizon proves to be the most effective strategy for navigating and enduring market volatility.
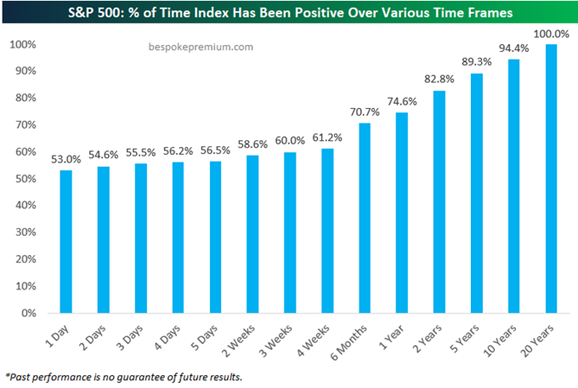
Source: Bespoke Invest
The cycle of rising interest rates appears to have concluded, and the prospect of rate cuts soon, is on the horizon. This transition may introduce a period of increased volatility as market participants begin to factor in the potential for a recession.
Therefore, I emphasize the value of equity structured products as a highly effective way to invest in equities, serving to navigate and potentially benefit from heightened market volatility. These products provide a certain level of capital protection, all the while aiding in the identification of favourable entry points in the market and offering opportunities to generate returns, even in a flat or negative market environment.
For specific stock recommendations and insights related to structured products, please don’t hesitate to reach out to me or your dedicated relationship manager.
Best wishes,

Manish Singh, CFA