

“Robust US Economy Delays Rate Cuts, Potential Labor Oversupply May Reignite Discussions”
Summary
Just a few months back, US interest rate markets were bracing for six rate cuts in 2024, deemed certain by June. Yet, persistent inflation and robust job growth have altered these forecasts dramatically. Now, predictions have been pared back to a possible single cut by November, with increasing speculation that rates might not be cut at all this year. Nevertheless, I still foresee rate reductions, likely three, perhaps in July, November, and December, with the Federal Funds Target Rate potentially dipping to 4.625% or lower by year-end.
The resilience of the US economy plays a key role in this scenario. Federal Reserve Chair Jerome Powell aptly described the US as “a bigger economy, rather than a tighter one.” Furthermore, the US Congressional Budget Office projects 3.3 million immigrants entering the country this year, boosting population forecasts for 2023-2025 and subsequently driving GDP growth. This influx, though beneficial to GDP expansion, might lead to an oversupply of labour later this year, potentially easing wage and inflation pressures.
In the current bull market, Artificial Intelligence (AI) has emerged as a central theme. Remarkably, the bull market kicked off soon after the launch of Chat GPT on November 30, 2022, and AI stocks, though recently underperforming slightly compared to the broader SPX index, have not significantly dragged down the overall market rally. Therefore, despite some setbacks, the equity market’s upward trajectory appears intact.
April Showers…bring May flowers?
April showers, those gentle yet persistent rains that punctuate the transition from winter’s chill to spring’s embrace, hold a unique significance in the natural rhythm of the seasons. As the Earth awakens from its slumber, April showers serve as nature’s gentle reminder of renewal and rebirth. They nourish the soil, coaxing dormant seeds to sprout and tender buds to unfurl, breathing life into the once barren landscape.
The opening line of Karen Chapell’s poem “April showers bring may flowers” goes like this:
April showers bring May flowers,
That is what they say.
…
This month, the stock market has experienced its own rendition of “April showers,” with falling stock prices (see table below) dampening any signs of positive market breadth, as interest rate cuts by the US Federal Reserve (Fed) have been pushed back. Throughout last week, breadth indicators have consistently weakened, with numerous stocks currently trading at least 10% below their 52-week highs. Just four months ago, in late December, the interest rate markets were confidently pricing in six rate cuts for 2024, with a 100% probability that the Fed would begin the cuts by the conclusion of its June 2024 meeting. Similarly, there was nearly 100% certainty that the European Central Bank (ECB) would follow suit.
However, since then, inflation and hiring have proven to be firmer than expected this year, weakening the case for pre-emptive rate reductions. US inflation has remained stuck in the +3% to +3.5% range, with indications of at least a temporary acceleration. This unexpected development has prompted a significant shift in expectations, causing equities to decline this month.
At present, the market is only factoring in one Fed rate cut by November. Additionally, as the window prior to the US election rapidly approaches and Fed officials maintain a hawkish stance in their commentary, the likelihood of “No rate cut” this year, is becoming increasingly priced in.
10 Year price chart: Federal Funds Target Rate – upper bound (FDTR index)

Source: Bloomberg
I believe the market is overreacting by shifting from expecting six rate cuts to none.
In my view, we are likely to witness rate cuts this year, albeit not as many as six. I anticipate at least three rate cuts, possibly in July, November, and December, with the Federal Funds Target Rate (FDTR) potentially reaching 4.625% or lower, by the end of 2024 (as indicated in the chart above).
Furthermore, I expect that by mid-2025, we could see the FDTR fall to +3.625% before the Fed deems it necessary to pause rate cuts once again.
One significant factor contributing to the absence of a rate hike thus far, is the robustness of the US economy.
Fed Chair Jerome Powell’s assessment that the US is “a bigger economy, rather than a tighter one,” hits the nail on the head in terms what’s happening in the US.
The US Congressional Budget Office’s (CBO) updated US population projections point to 3.3 million immigrants this year.
In doing so the CBO boosted US population estimates significantly, by +0.6% for 2023 (from +0.5% to +1.1%) and +0.7% for 2024 (+0.5% to +1.2%), and by +0.5% for 2025 (+0.4% to +0.9%).
These revised projections have led to substantial increases in population estimates. This has clearly boosted GDP and while supplies have increased (and continue to improve) over the last few quarters, understandably, inflation is taking time to get to the Fed’s target of +2%.
According to CBO estimates, the initial increase in population may temporarily suppress average real wages, but this effect is anticipated to diminish after 2027.
The US labour force
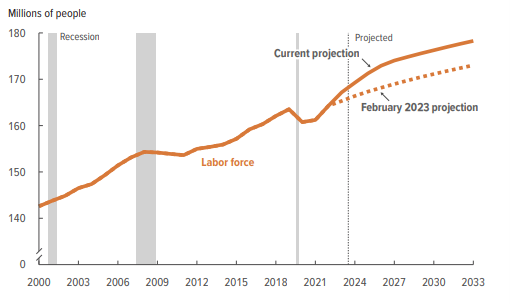
Source: Congressional Budget office (CBO)
Chairman Powell and the Federal Open Market Committee(FOMC) Committee, share the view that US labour demand and supply are currently well-balanced. With the anticipated surge in immigration, the labour market may face an “oversupply” situation this year putting downward pressure on wages and inflation.
Additionally, the outcome of the US presidential election could influence immigration policies. If Donald Trump secures re-election and implements stricter immigration measures, the current tailwind of demand may transform into a headwind, potentially leading to reduced economic activity and downward pressure on inflation.
Those expecting no rate cut this year may be acting in haste.
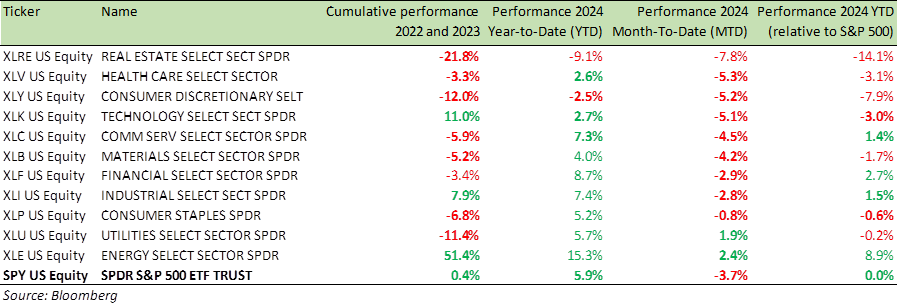
As equities have slid, as of Tuesday, fewer than a third of stocks in the S&P 500 (SPX) were trading above their 50-day moving averages (DMAs).
Interestingly, amidst this trend, every stock in the Energy sector maintained its position above its 50-DMA, indicating a sector-specific resilience amid broader market fluctuations.
- The Real Estate sector (XLRE) has endured the most challenging performance since the beginning of 2022, when the equity markets corrected, with the SPX down -25% by October of that year. While equities have recovered since then, the returns are not impressive at all (table below)
- The Tech sector (XLK), often the focus of numerous positive reports, ranks as the second-best performing sector over the past 28 months. Despite its acclaim, its annualized return falls just below +5%, trailing behind the Energy sector’s impressive +26% per annum
- And over the past 28 months, The SPX is up +6.1%, for a paltry annualised return of +2.5%
Is the SPX really overbought?
I don’t think so.
Benchmark US equity sector performance (2022 and 2023; 2024 YTD and 2024 YTD relative to S&P 500 Index)
While the SPX at the index level is less than -5% from its 52-week highs, the average stock in the index is now more that -12% below its 52-week high.
Consumer Staples, Health Care, Communication Services, and Consumer Discretionary stocks are trading the farthest below 52-week highs.
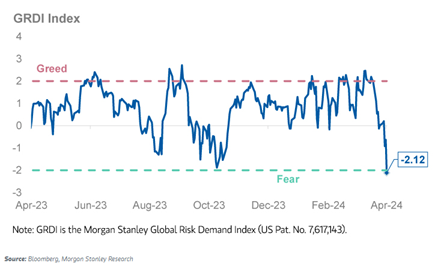
The Morgan Stanley’s proprietary Global Risk Demand Index (GRDI) Index has moved rapidly from “greed” to “fear.” The market sell-off seems overdone.
The next two line of Chapell’s poem “April showers bring may flowers” is as follows
But if all the showers turned to flowers,
We’d have quite a colourful day!
Let’s hope “April showers bring May flowers” come true and we have more green on our screens in the month of May!
Markets and the Economy
On Tuesday, a BBC news headline flashed “FTSE 100 stock index closes at new all-time high.”
A Financial Times (FT) headline read – “London stocks play catch-up with global peers as expectations for UK rate cuts build.” as the FTSE 100 (UKX) index closed on Monday at 8,023.87 points to mark the new record, surpassing its previous high of 8,012.53 in February 2023.
What both BBC News and the FT failed to convey to their readers is this: When accounting for currency differences, on a total return basis, the FTSE 100 in USD terms has only seen a modest increase of +30% over the past decade, with an annualized return of +2.7%. In stark contrast, the SPX has soared by +225%, boasting an annualized return of +12.5%, outperforming the UKX by a factor of five.
Before anyone rushes to attribute this divergence to Brexit, it’s important to note that it began well before Brexit, as early as 2014 (as illustrated in the chart below). Prior to 2014, UK and US equities exhibited a high degree of correlation. From 2004 to 2014, the SPX and UKX in USD terms both saw nearly identical total returns of +102% and +99%, respectively.
The UK seems to lack innovative companies and the UKX has turned into a backwater compared to the hallowed SPX index.
Great Britain, once a key player in shaping the modern world and laying the groundwork for the American legacy, now finds itself striving to even play a catch up.
A nation cannot tax and regulate its way to prosperity. With highest tax and regulatory burden in decades, you’d be forgiven for thinking that the Labour Party has been at the helm of the UK for the past decade and a half.
20 Year total return chart: FTSE 100 index (in USD) and S&P 500 index

Source: Bloomberg
Last week began with positive economic news as March’s US Retail Sales report exceeded expectations, following two months of weaker-than-expected reports. February’s report was also revised higher.
However, this was offset by Tuesday’s Housing Starts, which fell short of expectations, possibly due to seasonal issues related to Easter falling in March this year.
Jobless claims and the Philly Fed report later in the week surpassed expectations, but Existing Home Sales came in weaker than expected. Overall, the week saw a relatively even split between stronger and weaker-than-expected US economic data.
This week, a pair of S&P surveys revealed a loss of momentum in the US economy during April, marking the first decline in new orders and reduced employment since the onset of the pandemic.
- The flash US manufacturing purchasing managers index (PMI) dipped to a four-month low of 49.9 in April, down from 51.9 in March
- Similarly, the S&P flash US services PMI declined to a five-month low of 50.9 this month, compared to 51.7 in March
These surveys serve as early indicators of monthly economic performance. Notably, new orders, which reflect future sales, declined for the first time in six months, leading to increased pessimism among businesses regarding the economic outlook. High interest rates and elevated inflation seem to be dampening customer demand again. Inflation may be easing but the prices are still rising as the inflation rate is positive. The persistence of elevated inflation and high borrowing costs is likely to put further downward pressure on the economy in the spring and summer.
A notable phenomenon in market activity over the past month, has been the simultaneous rally in both Gold and the US Dollar.
Despite the common narrative of gold rallying due to investor scepticism towards the dollar and central banks, the USD has also been on the rise. This is unusual, as these two asset classes typically exhibit an inverse correlation.
However, in the weeks leading up to April 15, the US Dollar Index saw a +2.7% increase, while gold surged by over +10%.
Such a scenario is rare, occurring only eight times since the early 1970s, with two instances in the early 1980s and three during the Financial Crisis.
The table below outlines the performance of the SPX, gold, and the Dollar Index following previous occurrences of this phenomenon.
- The short-term performance of the SPX varied, but over the subsequent six months, it showed a median gain of +6.4%, with positive returns six out of eight times. One year later, the median gain was even more significant at +15.8%, though there were occasional declines
- As for gold, it typically experienced declines over the following one, three, and six months, while the Dollar Index often maintained its strength
If you fear inflation is going to stay in the 3% to 4% range, then selling your equities, as rate cuts are delayed, may be a losing trade.

Source: Bespoke Invest
One other headline that caught my attention this week – “FTC bans noncompete clauses that limit job switching, suppress wages”.
The US Federal Trade Commission (FTC) has enacted a rule banning noncompete agreements that restrict workers from joining rivals or starting similar businesses. This decision, influenced by concerns about stifling worker mobility and depressing wages, received a 3-2 approval from the FTC’s Democratic majority, led by President Joe Biden. This marks the first economywide regulatory change in over 50 years aimed at enhancing competition.
The new rule limits the enforcement of existing noncompete clauses exclusively to senior executives and prevents the creation of new noncompete agreements for them in the future. The FTC argues that such measures decrease job market fluidity, disadvantaging workers not covered by them as job opportunities diminish due to reduced turnover. This could also harm the economy by preventing businesses from recruiting essential personnel.
Despite the potential for legal challenges from business groups, the FTC’s ruling, proposed in January 2023, is set to take effect in August. The elimination of noncompete agreements is expected to boost wage growth and enhance productivity, positively impacting US economic growth.
Critics, however, worry about the shift from legislative to regulatory governance, urging Congress to address such issues through formal legislation rather than executive action. The debate extends beyond high-level executives; anecdotal evidence from social media reveals that even hourly workers have faced restrictive noncompete clauses, significantly impacting their economic freedom and wage potential. This broad application of non competes underscores the FTC’s initiative to foster a more competitive, equitable job market. There goes the “gardening leave” for job switchers and with it final hope of US inflation ever getting to +2% ever again?
I am only kidding.

Source: Federal Trade Commission (FTC)
For those outside the US, the issue of “non-compete” agreements may be unexpected. However, reading comments on social media, as highlighted below, sheds light on the concerns the FTC is attempting to address.
“My younger daughter ten years ago had to sign a 50 mile/2 year non-compete clause to work at Jimmy John’s one summer. She obtained no confidential or special knowledge about how to make sandwiches through that job, but that didn’t stop Jimmy John’s from requiring her to sign the agreement to get the job.”
“In some limited cases these contracts have made sense in the past, but they’ve started to permeate every industry. My physician recently had to move when she left her current practice because they had a 30 mile non-compete agreement in place. There aren’t any trade secrets on the line for a family physician, so a contract like that really just seems like a punitive measure intended to prevent the employee from leaving the employer.”
It seems “non-compete” has been applied to frontline workers, such as hourly employees at Wendy’s. This clearly suppresses wages as FTC has pointed out and particularly hurt employees at the bottom of the income scale. Eliminating “non-compete” will lead to higher wages and hopefully higher productivity. All good for US equities and US GDP growth
Moving on…
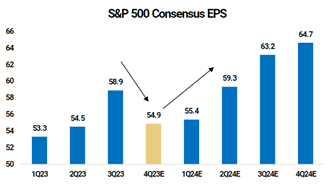
The Q1 earnings season for SPX companies is in full swing and while the earnings have improved on an aggregate basis, at the index level, the 4Q23 and 1Q24 are both expected to be below 3Q23 earnings. Since the start of the Q124 earnings seasons over two weeks ago, the 4Q24 earnings consensus estimates have been revised lower by -8%.
However, consensus is still pricing +18% Earnings per share (EPS) growth for the full year 2024 (see chart below).
Source: Morgan Stanley
Every bull market has its defining theme, and the standout of this particular bull market has undeniably been Artificial Intelligence (AI). Interestingly, the bull market commenced within weeks of the launch of Chat GPT on November 30, 2022, with the Nasdaq’s closing low occurring within a month of this launch.
If the recent highs in March, truly marked the beginning of a significant downturn or bear market, we would expect the AI stocks, which were the stars of the prior bull market, to be the hardest hit. However, thus far, this hasn’t been the case. Since the closing high on 3/28, AI stocks (represented by 91 stocks, Global X Funds Global X Artificial Intelligence & Technology ETF (AIQ)) have seen an average decline of -5.5%, compared to -3.4% for the SPX index as a whole.
So, while AI stocks are underperforming, it’s hardly been by a significant margin.
As previously mentioned. The equity rally is not over by any means.
Earnings expectations remain positive, and while rate cuts have been postponed, they have not been ruled out entirely. I still anticipate three rate cuts this year, and market downturns provide an opportunity to invest in high-quality stocks.
A further increase of over +10% in the SPX from its current level, appears very feasible under the current circumstances.
For specific stock recommendations and insights related to structured products, please don’t hesitate to reach out to me or your dedicated relationship manager.
Best wishes,

Manish Singh, CFA