


Amidst geopolitical uncertainties, the unwavering demand for US equities stands out as a beacon of resilience.
Summary
In a world where the economic skies are occasionally clouded by the unpredictable winds of monetary policies, the tremors of geopolitical uncertainties, and the lightning strikes of regulatory changes—such as Apple’s recent stock stumble and China’s new tech directives—it’s the steadfast demand for US equities that shines like a beacon of resilience. Amidst this backdrop, a golden surge is powering the markets forward: The tidal wave of share buybacks.
With projections setting S&P 500 companies’ repurchases at an exhilarating $925 billion in 2024, soaring to the historic peak of over $1 trillion by 2025, this phenomenon is not just a number—it’s a testament to the robust vitality of the technology sector and the easing financial conditions as whispers of interest rate cuts by the Fed grow louder. These buybacks are the market’s vote of confidence, the tailwind that will support the continued run of equities.
Meanwhile, a seismic shift has occurred across the Pacific. After eight long years, the Bank of Japan has steered away from the shadowy depths of negative interest rates, embracing the light of positive territory at +0.1%. This bold pivot, coupled with the cessation of unconventional asset purchases, marks a new dawn for Japan’s financial landscape. As the Land of the Rising Sun embarks on this journey, the ripples could be felt across the globe, potentially luring Japanese investors back to domestic shores and influencing the ebb and flow of US mortgage rates and Treasury yields. This monumental shift underscores a dynamic interplay of global forces, hinting at a future where the allure of US assets might be recalibrated in the grand tapestry of international finance.
No Interest Rate Cuts? Equities Rally Regardless
Last week was all about global central banks and, more specifically, about the Federal Reserve (the Fed).
As the week commenced, investors braced themselves for a trio of pivotal events: Tuesday’s rate decision from the Bank of Japan (BoJ), Wednesday’s Federal Reserve (Fed) meeting and Thursday’s rate decision by the Bank of England (BoE).
Anticipation was high as the BoJ was expected to raise rates above zero for the first time in years, the BoE was expected to stay put, and the Fed was widely expected to quash any hopes of a May rate cut. (More on the BoJ’s rate decision and its implication are covered in the “Markets and the Economy” section below).
As predicted, the BoE kept rates on hold, the BoJ indeed increased rates, and although the Fed wasn’t overtly hawkish, it raised its forecast for both core inflation for this year (from +2.4% to +2.6%), and the long-term Fed Funds Rate (from a +2.50% to +2.625%).
Given the rapid rise of the equity market S&P500 (SPX) – up +27% from its low in October 2023 – leading up to these events, the market was primed for profit-taking.
So, what happened?
The SPX, Nikkei 225 and Stoxx 600 index all collectively reached record highs.
10-year price chart: S&P 500 Index, Nikkei 225 Index and Stoxx600 Index
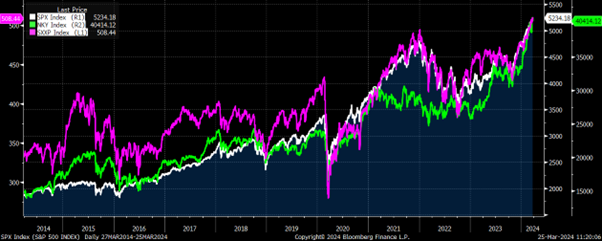
Source: Bloomberg
Over the last fifty trading days, the SPX has closed at a 52-week high on 22 trading days.
What’s particularly remarkable about the last four to five months, is the absence of even a minor pullback of -2% in the SPX (based on closing prices).
According to data compiled by our research provider, Bespoke Invest, since the inception of the five-day trading week in late 1952, there have been just seven other occasions when the SPX remained without experiencing a downturn of this magnitude for as long or longer. The most recent instance was in 2018, spanning 108 days, while the longest unbroken streak persisted for 176 trading days in 1954.
The table below outlines the SPX ‘s performance after each previous period during which it went 100 or more trading days without a -2% pullback. Given the extended duration without even a modest decline, one might expect the market to be poised for a more significant downturn.
However, this wasn’t generally the case.
Six months later, the SPX recorded gains on all seven occasions, with a median increase of +8.2%. Similarly, one year later, the median gain was +9.4%, with gains observed in six out of seven instances.
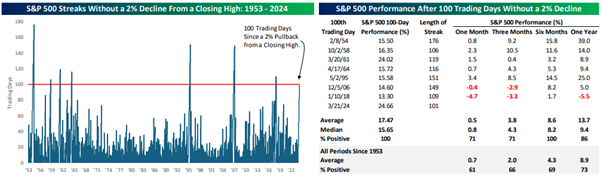
Source: Bespoke Invest
The way the market reacts to Fed Chair Jerome Powell’s comments may also be starting to shift.
Last week’s reaction to the Fed statement (purple line in graph below) also bucked the general long-term “Powell plunge,” on Fed days since he became Chair in 2018.
As shown below, whether you look at his entire tenure as Fed chair or break it up into different slices during that period, Powell has not exactly been a stock market whisperer.
With a gain of +0.89% for the SPX last Wednesday, it ranked as the 14th best single-day performance on a scheduled Fed Day, of the 48 days since Powell became Chair in March 2018.
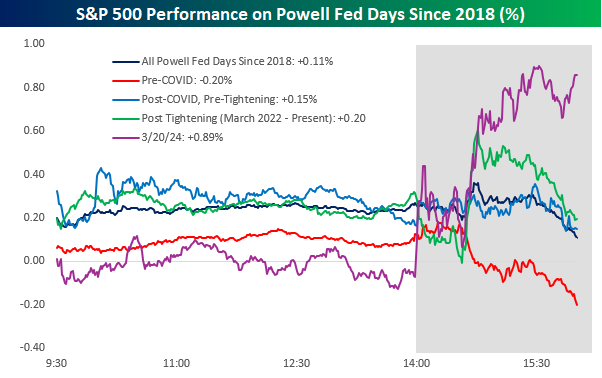
Source: Bespoke Invest
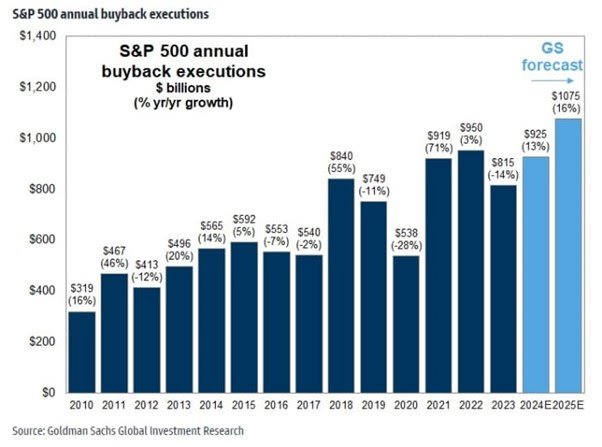
Furthermore, according to a memo from Goldman Sachs (GS), there’s a trillion-dollar impetus – share buybacks by companies – that underscore why the rally in US equities is expected to continue.
Goldman Sachs anticipates that US companies will engage in share buybacks exceeding $1 trillion for the first time in 2025, driven by robust earnings growth in the technology sector and more relaxed financial conditions, as the Fed considers reducing interest rates.
Analysts at GS forecast a +16% increase in share repurchases by SPX companies, reaching $1.08 trillion in 2025, following a +13% rise to $925 billion in 2024 (see chart below).
Companies typically repurchase shares when they feel optimistic about the future and perceive their stock price as undervalued. So, the buy-backs are a tailwind that will support the continued run of equities.
Additionally, in 2023, US households were net sellers of $57 billion in US equities, attracted by favourable cash yields, but the tide is expected to turn this year, with households poised to become net buyers, to the tune of $100 billion. While a May rate cut, at this point, is out of the question, the market is fine with that, if the ultimate direction of interest rates is still lower.
The prospect of the Fed easing alongside robust economic growth, is expected to prompt households to shift funds from the money markets into stocks. Currently, US money market assets under management owned by households stand at $3.8 trillion – the highest level on record and approximately $1.5 trillion above pre-pandemic levels.
Despite occasional turbulence stemming from monetary policy fluctuations, concerns about overvaluation, geopolitical tensions, or regulatory issues like those accompanying the recent decline in Apple’s stock price, China’s guidance to limit the use of US-made microprocessors and servers in government computers, there remains a steadfast demand for equities.
Markets and the Economy
In the latter half of 2023, as the US economy displayed resilience, and investors’ expectations for an imminent rate cut by the Fed were quickly dashed.
This disappointment coincided with the yield on the US 10-year Treasury reaching 5%, its highest level since early August 2007.
Equities suffered a substantial setback, shedding over -10% of their value during the three-month period from August to October, with the sell-off reaching its nadir on October 27, when the SPX hit the 4117 level.
The prevailing pessimism was palpable amongst many market participants and commentariat. For years, investors faced no alternative to stocks in an ultra-low interest rate environment. With the Fed Funds rate at 5.25%, “T-Bill and Chill” – buy short term Treasury bills, earn over 5% and relax – became an investment strategy.
However, since then, a remarkable turnaround has occurred.
Despite the absence of a rate cut, the SPX has surged by +27% from its lows in October (as depicted in the table below). Huge revenue and earnings beat by Nvidia (NVDA) has led to an AI-driven boom, which is stoking demand and fostering a buoyant financial landscape.
As the market has continued its upward trajectory, sentiment on Wall Street has undergone a shift too. With numerous 2024 year-end targets being surpassed well ahead of schedule; major banks have revised their forecasts upward:
- Société Générale (GLE) raised its year-end target to 5,500 from 4,750
- Bank of America (BAC) recently increased its year-end forecast to 5,400, aligning with UBS, which adjusted its target to this level in February
- In February, Goldman Sachs (GS) elevated its forecast to 5,200, marking its second upward revision since late last year. Last week, GS’s US equity strategist, David Kostin, argued for the possibility of the S&P 500 reaching 6,000 by the end of 2024, attributing this optimism to the relentless ascent of major technology companies
I must admit, when everyone gets bullish, I do start getting nervous. It’s often said that bull markets thrive on a “wall of worries” and falter amid excessive optimism.
Nevertheless, there are reasons for reassurance. The US economy continues to expand at a rate exceeding +2% annually, and the prospect of rates easing remains on the horizon
Global Equity Index Performance (2023; 2024 YTD and 27 Oct 2023-2024 YTD)

In a significant development, Japan’s unions secured an average salary increase of +5.28%, based on the initial results of Japan’s annual spring wage negotiations, as reported by the Japanese Trade Union Confederation last week. This marks a notable departure from the trend of the past decade, where the final annual increase never surpassed +2.4%.
In response to these shifts and amid signs of a potentially new era of stable inflation in Japan, the Bank of Japan (BoJ) made substantial changes to its monetary policies. After eight years, the BoJ ceased negative interest rates and began unwinding most of its unorthodox monetary easing measures. The main policy rate was raised to +0.1%, and explicit targets for the yield on 10-year Japanese government bonds were discontinued. Furthermore, the BoJ announced plans to halt the purchase of stocks and real estate investment trusts, indicating a reduction in commercial paper and corporate bond acquisitions.
For close to a decade, the BoJ has been renowned as the most accommodative central bank globally. Yet, the dynamics influenced by the pandemic, coupled with the BoJ’s unwavering dedication to lose monetary policies, have catalysed a surge in inflation within Japan. This inflationary trajectory has the potential to become self-perpetuating, particularly as labour force participation rates reach their peak, bolstering the bargaining power of labour and resulting in significant wage hikes.
However, despite these adjustments, the BoJ’s cautious approach remains evident. Monthly purchases of ¥6 trillion in Japanese government bonds will continue, emphasizing the central bank’s commitment to maintaining accommodative financial conditions “for the time being.” i.e. much likely won’t change in the short term.
Over the long term, the implications of positive interest rates in Japan could have far-reaching effects, influencing various aspects such as US mortgage rates and US Treasury yields.
- Japanese individuals and companies have long been substantial investors abroad, actively seeking higher yields. As of the end of last year, Japan’s foreign portfolio investments amounted to approximately $4.2 trillion. A significant portion of this investment originates from Japanese pension funds and insurers, who may reassess their investment strategies if Japanese interest rates rise, finding domestic options more appealing
- For example, Japanese investors currently hold approximately $1.1 trillion of Treasury bonds, positioning them as the largest foreign holders of US Treasuries. If Japanese interest rates become more favourable, these investors may opt to redirect more capital toward domestic investments, rather than maintaining their current allocations abroad
If US growth undergoes structural decline, leading to a narrowing of the yield advantage of many US assets, the impact of any rate rise in Japan will be significant.
The BoJ will probably pace its rate increases slowly: The past couple of years have, if anything, reaffirmed its reputation for moving slowly and deliberately. Moreover, while inflation is still high by Japanese standards,+2.2% in January, it has already cooled from the peaks of last year.
Japanese bond yields have picked up, but they are still substantially lower than in the U.S. The rate differential between 10-year government bonds in the U.S. and Japan stands at 3.5 percentage points (see chart below). This is significantly lower than the 4.2-percentage-point gap of a few months ago, but still way higher than the 1.5 percentage points of three years ago.
USGG10, JGB10 spread analysis
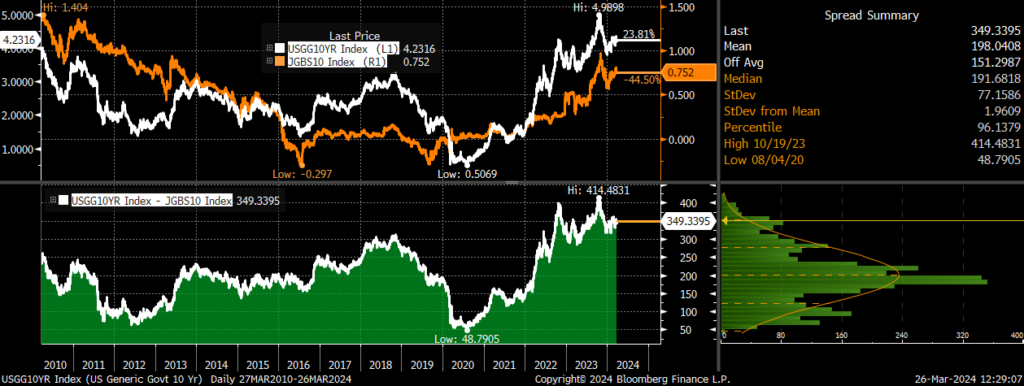
Source: Bloomberg
And what about the Japanese Yen?
At the press conference last week, BoJ Governor Kazuo Ueda reiterated the importance of maintaining accommodative conditions. Ueda emphasized that there is still a considerable gap for price expectations (inflation) to reach the targeted +2%. While the move out of negative rates was hawkish at the margin, BoJ officials maintained their plans to keep policy easy. As a result of the actions and comments, the Japanese yen sold off on the news, and has continued to sell off.
Taking a very long-term look at the yen, the roughly 152 resistance level has been in place for decades. The yen also weakened (rising price in the below chart) towards those levels back in the late 1990s and late 1980s, before rallying.
If the yen does manage to take out that 152 resistance level in the weeks/months ahead, there would be very little resistance between here and 200, and that would likely have some pretty major macro ramifications for capital flows in Japan and around the world.
Japanese Yen spot rate: 1980 – 2024
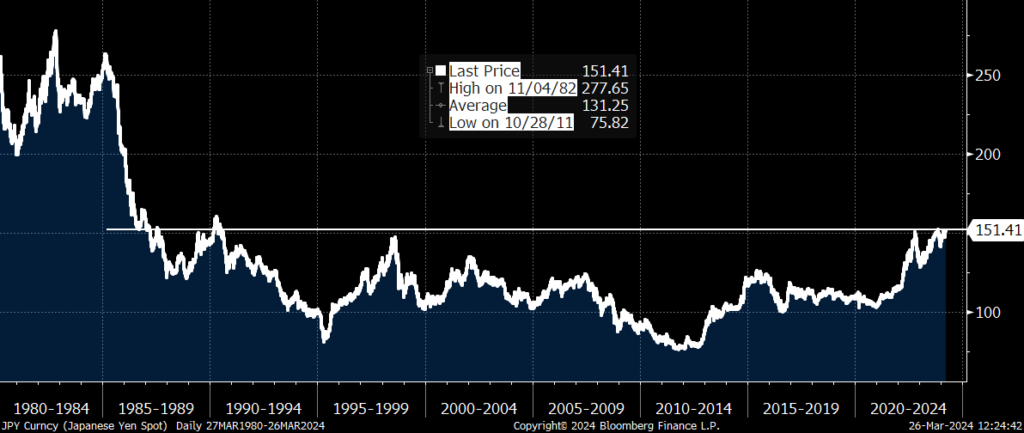
Source: Bloomberg
Meanwhile, last week, China’s Shanghai Composite closed above its 200-day moving average, for the first time in more than six months.
This resurgence beyond the 200-DMA marks a notable shift in sentiment for the once beleaguered Chinese stock market. Despite this rally, the index continues to trade approximately 20% below its all-time high recorded in February 2021. One to watch.
As outlined in the January Market Viewpoints:
- The current bull market began in October 2022. To surpass the duration of the next shortest bull market (March 2020 – Jan 2022), this one would need to persist until at least the end of July 2024
- Looking to the Median: Post-WWII, the median bull market experienced a surge of +83.1% over 1,418 days. If we apply these medians to the current bull run, we could anticipate an SPX target of approximately 6,700 by late May 2026
Bull markets are periods of above average market returns. Something will knock the bull off course, but for now it remains on track.
A shift in interest rate projections, without a downturn in economy is likely to trigger a “catch-up” scenario for the majority of S&P 500 stocks, which have been held back by concerns about sustained high interest rates and consequently haven’t experienced as significant a rally as the mega-cap tech giants.
A further increase of over +10% in the SPX from its current level appears very feasible under these circumstances.
For specific stock recommendations and insights related to structured products, please don’t hesitate to reach out to me or your dedicated relationship manager.
Best wishes,

Manish Singh, CFA