“Increased earnings from interest and dividends are sustaining America’s economic growth; however, a slowdown is building“
Summary
According to the U.S. Commerce Department, Americans earned approximately $3.7 trillion from interest and dividends in the first quarter of 2024, at a seasonally adjusted annual rate—an increase of about $770 billion from four years ago.
Most U.S. mortgages are long-term and fixed at low rates, primarily benefiting middle-to-high-income families who hold savings. This is crucial as these groups account for nearly 80% of U.S. consumption, and consumer spending makes up 68% of the US GDP. The rise in interest rates has inadvertently boosted consumption spending from “interest income,” helping to stave off a recession in the US economy.
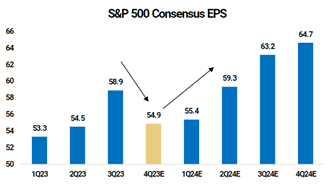
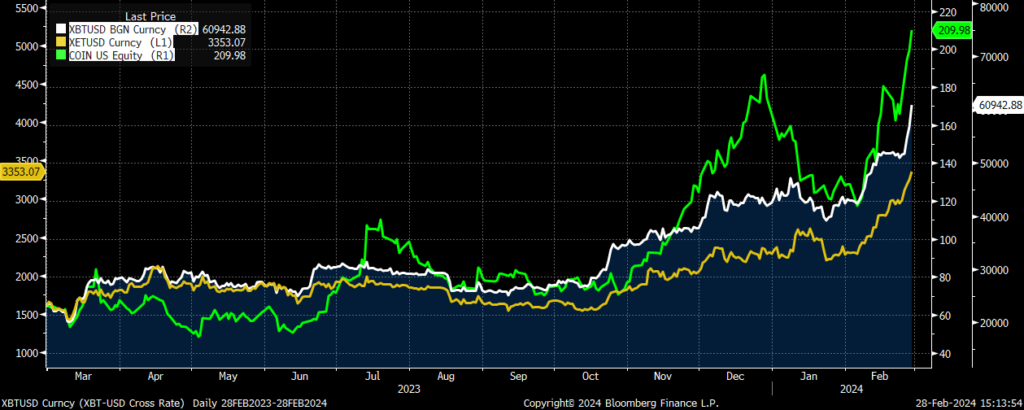
The traditional “sell in May and go away” strategy did not hold this year—the S&P 500 surged by 4.8% in May, its best performance for the month in 15 years. Since the end of April, the S&P 500 has climbed by 5.9% and reached an all-time high. However, while the index is at a peak, it has only risen by 10% since December 2021, despite earnings per share increasing by over 20%. This indicates that the equity rally still lacks broad participation.
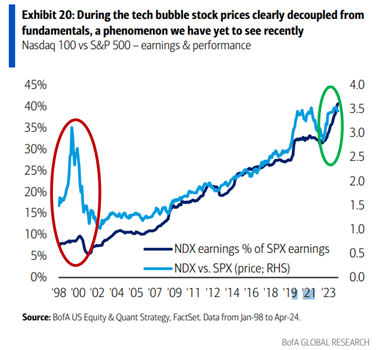
This performance doesn’t mean that tech stocks are mirroring the dot-com bubble of 2000. Though the price increase may seem similar, today’s earnings growth is robust and supports current valuations. Unlike during the tech bubble, we have not observed a clear disconnect between stock prices and fundamentals.
US Economy still resilient; job market cooling down
We’ve discussed high interest rates extensively in these pages over the last few months, and I will certainly have more to say on them further down and throughout the rest of the year.
First, I want to share some stunning data with you.
While high interest rates can be burdensome for borrowers, they can also be beneficial for savers.
The chart below effectively explains why those predicting a US recession have been surprised: Interest income.
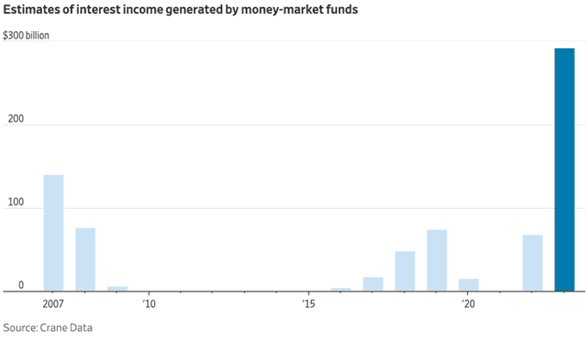
People flocking to money market funds, have been earning record income, which has bolstered consumer spending.
Arguably, the primary beneficiaries of this interest income, are middle-to-high-income families with savings, which is significant, because these groups account for nearly 80% of consumption in the US and consumer spending constitutes 68% of US GDP. Thus, the inadvertent benefit of higher rates has been a boost to consumption spending from “interest income,” helping to prevent the US economy from slipping into a recession.
On the liability side, most US mortgages are long-term and fixed at low rates. Therefore, higher rates are likely to continue to help and strengthen household balance sheets until such time as we see the economy slowing down due to a rise in unemployment.
So, let’s look at the US jobs market.
The US jobs report last Friday came in higher than expectation, albeit the unemployment rate rose to 4%
Employers added 272,000 new jobs in May, according to the US Labor Department, surpassing the 190,000 economists had predicted and outpacing April’s numbers. Additionally, average hourly earnings increased by +4.1% year-over-year, beating forecasts.
However, is there more to the US jobs report than meets the eye?
The Bloomberg headline caught my eye – US Payroll Gains Not as Robust as Reported, BLS Data Suggest. It contained some surprising details.
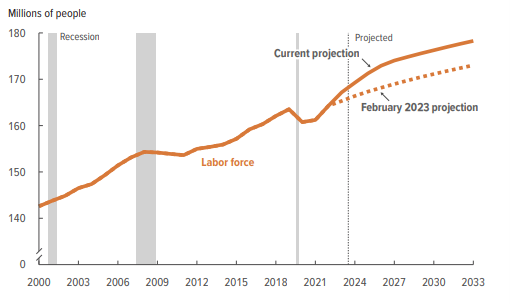
“Data published Wednesday by the Bureau of Labor Statistics suggest payrolls might have grown about 60,000 less per month on average last year. The new figures, from the Quarterly Census of Employment and Wages, cover more than 95% of US jobs, and are eventually used in annual revisions to the monthly data.”
A shortfall of 60,000 jobs per month equates to about 720,000 jobs for the year. The US non-farm payroll totalled 2.88 million for 2023. Therefore, according to the headline, the real number might be closer to 2.16 million, suggesting that job creation was overestimated by a significant 25%.
This implies that the US job market may be much less robust than Federal Reserve Chair Jerome Powell and his colleagues believe.
US President Joe Biden’s administration often highlights the fact that the US economy has maintained an unemployment rate below +4% for 27 consecutive months, the longest streak since 1967.
Should we really take this at face value? Expect the upcoming downward revision to US non-farm payrolls for 2023 to end that streak.
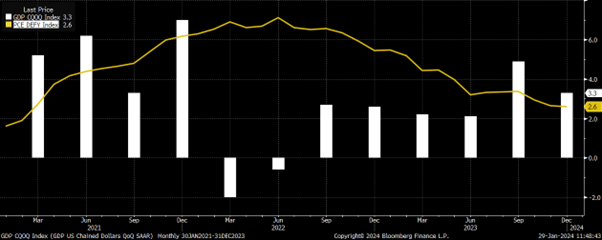
The US economy’s growth was below expectations for the first quarter of this year. The second estimate of GDP growth revealed that the US economy expanded by +1.3% in Q1 2024, a decrease from the initial +1.6% figure. This comes after a growth rate of +3.4% in Q4 2023. A noticeable decline in the growth trend.
The slowdown in Q1, was mainly driven by a declining estimate of consumption, suggesting a flagging consumer.
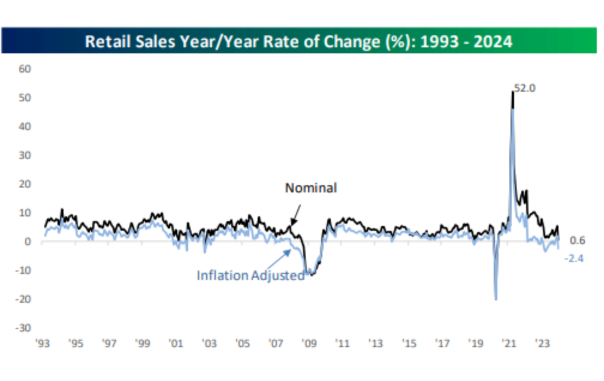
During Walmart’s earnings call in May, management highlighted a strategy to attract more cost-conscious customers by lowering prices. CEO Doug McMillon noted outright deflation in general merchandise and mentioned that overall inflation for the business, was half of what it was last year.
McMillon also announced that the company has reduced prices on 7,000 products. Walmart’s website now features a red “Rollback” button to highlight items with reduced prices.
In response, Target (TGT) announced that it is “lowering prices on approximately 5,000 of your favourite food, beverage, and household essential items.”
When was the last time you heard talk of a price war on basic grocery items?
The cumulative impact of years of inflation appears to be catching up with consumers and eroding their savings cushion—something that companies selling discretionary goods, from Starbucks to Kohl’s, are noting in their public reports.
The US Personal Saving Rate is back to around +3%, with April’s rate at +3.6%, well below the 12-month average of +5.2%.
The GDP report also revised consumer spending growth down to +2% from the initial estimate of +2.5%, while private inventory investment and federal government spending were weaker than expected. All good signs for inflation cooling down.
Fed Chair Powell often cites the ratio of job openings per unemployed worker as an indicator of tight labour markets, but it has now returned to pre-COVID 2019 levels at approximately 1.2
(chart below). This ratio was 2 to 1 when the Fed began tightening a couple of years ago.
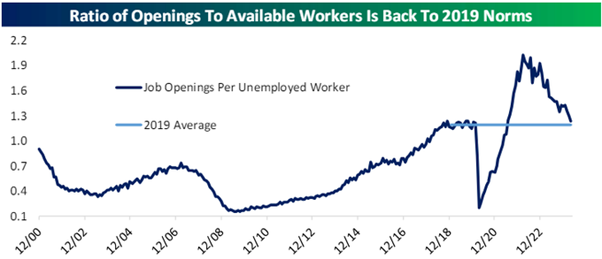
Source: Bespoke Invest
Another critical data point to focus on is the Chicago Manufacturing PMI, which plummeted to 35.4, the lowest level since the COVID-19 lockdowns in May 2020. This completes a brutal series of drops since November’s spike to 55.6.
This is the lowest reading, not associated with a recession, on record; in other words, every other time the Chicago PMI has been this low, the US has been in or just emerging from a recession.
Will this time be different, or are we in a recession without realizing it? The Fed can avoid a recession or make it a shallow one, by cutting rates.
MNI Chicago Business Barometer seasonally adjusted (Chicago PMI Index, CHPMINDX): 1960-2024 price chart
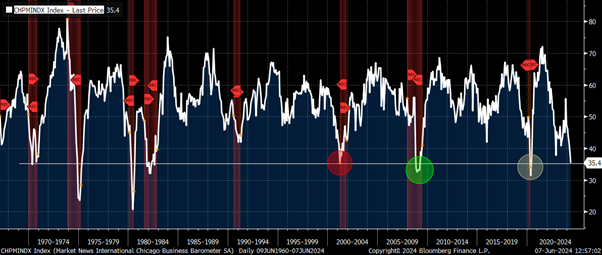
Source: Bloomberg
Is inflation really still a problem?
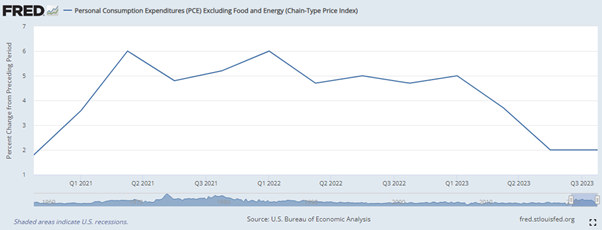
The Federal Reserve’s preferred measure of inflation, the Personal Consumption Expenditure (PCE) index, is currently running at +2.7% (with overemphasis on backward looking rents data). The Fed’s target for inflation is +2%.
Shouldn’t the Fed be more concerned about the economy, given the signs of a slowdown building up?
Isn’t +5.25% restrictive? Even with a +0.25% cut, rates at+ 5% will still be restrictive.
Given the lag in the transmission of monetary policy into the economy, keeping rates at the current level until inflation reaches 2% risks overdoing restrictive policy and triggering a recession.
A recession is the last thing the US and the global economy need. It would only necessitate deeper rate cuts, something Chairman Powell and his team would prefer to avoid, given the pitfalls of excessively low rates, as seen over much of the last 15 years.
The Federal Open Market Committee (FOMC) meets this Wednesday to deliberate over the level of the Federal Funds Rate. The market is pricing in a 3% probability of a rate cut at the June 16 meeting and a 20% probability for the July 31 meeting.
That 20% probability for the July meeting is on the low side and I wouldn’t be surprised if we get first rate cut of this cycle at the July meeting.
Markets and the Economy
On Wednesday last week, the Canadian Central Bank (BoC) cut rates by +0.25% and said – while the disinflation process will be “uneven” and “risks remain,” it is “reasonable to expect further cuts,” if inflation remains contained.
In comments after the decision, Governor Tiff Macklem, emphasized that the path of cuts is “likely to be gradual,” and that the timing “depends on incoming data.” He also emphasized that the BoC “doesn’t need to move in lockstep with the Federal Reserve” and that there are “limits to the divergence with the US,” but that Canada is “not there yet.”
On Thursday last week, the European Central Bank (ECB) cut rates by +0.25%.
ECB President Christine Lagarde, explicitly refused to say that the ECB is “in a dialling back phase” and emphasized that the speed and timing of any future moves would be “determined by data.” She, however, noted that despite the cut, rates are “not close to neutral,” i.e. more cuts are down the line.
As inflation continues to fall, real rates (nominal rates minus inflation) get elevated. Higher real rates make monetary policy “restrictive” and that will force the central banks’ hands to cut rates further.
In last month’s Newsletter I wrote – Let’s hope “April showers bring May flowers” comes true and we have more green on our screens in the month of May.
As the oft repeated “sell in May, and go away” adage, failed to materialise – the S&P 500 (SPX) rallied +4.8% in May for the best May for the SPX in 15 years (and the SPX is up +5.9% since the end of April) and has hit an all-time high.
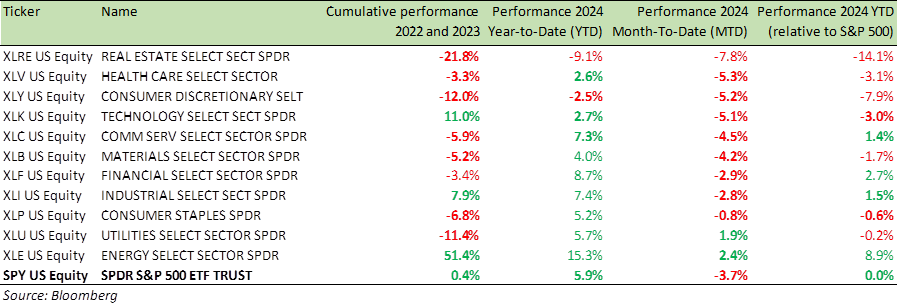
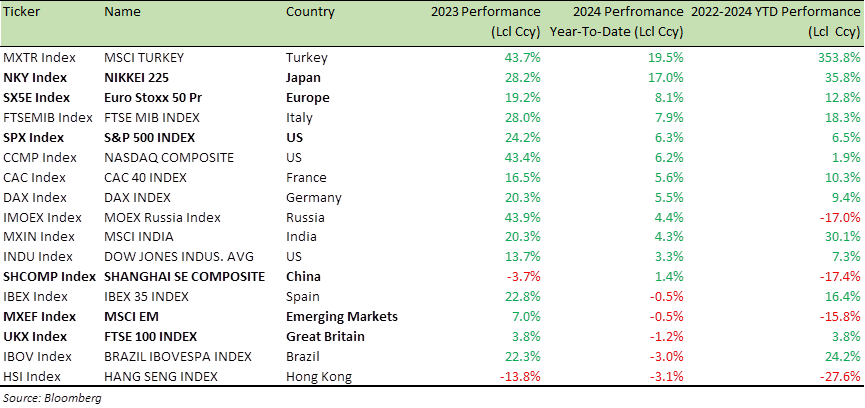
The SPX is at all time hight, but did you know that the SPX is up only +10% since Dec 2021 (see last column in the table below). In the meantime, earnings per share have increased by over +20%.
Global Equity Index Performance (2024 YTD, April 2024, May 2024 and since the peak of Dec 29, 2021)
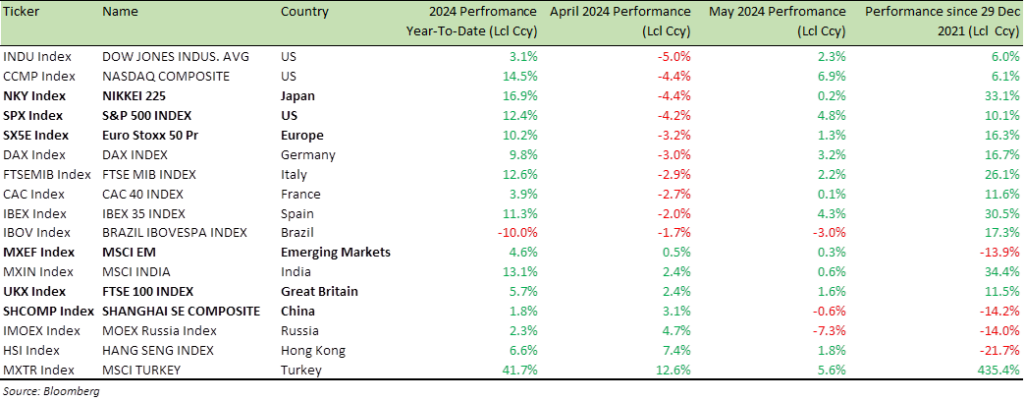
The rally lacks broad participation.
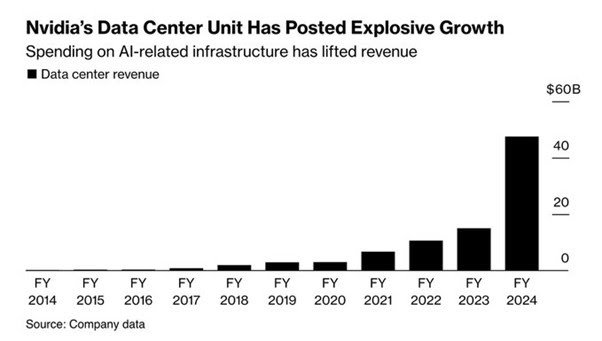
The SPX’s year-to-date gain of +12.5% would drop to +7.9%, if NVIDIA were excluded, and it would fall to just +4.4% if the “Magnificent Seven” (Apple, Microsoft, Alphabet, Amazon, NVIDIA, Tesla, and Meta Platforms) were removed.
This isn’t to say that tech stocks are repeating the dot-com bubble of 2000, as some are suggesting. While the price increase may be similar, unlike then, earnings growth has been robust, supporting the current prices.
The chart below from Bank of America, comparing the Nasdaq 100 and SPX, in terms of earnings and performance, underlines this point.
During the tech bubble, stock prices clearly decoupled from fundamentals — a phenomenon we haven’t seen recently.
Also, despite the inflation talk, what many fail to realise is that US disposable income and employee compensation – have held up well over the last four years, when compared to the PCE measure (see chart below).
The key question is whether it will continue to sustain moving forward. While the economy has been showing signs of weakness, one thing we can be thankful for is the fact that gas prices have started to decline, and Oil has tumbled from $87 to $73 per barrel, over the last eight weeks.
US disposable income, PCE inflation, US wages – 5 year price chart

Source: Bloomberg
The US economy is healthy and the case for equities remains strong as ever. Any rate cut (if we get one this year) will only help equities.
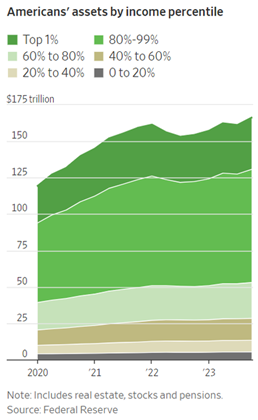
Increasing investment income and household wealth, alongside near-full employment, have so far helped Americans cope with rising prices. Here are more remarkable stats:
- Americans in the first quarter earned about $3.7 trillion from interest and dividends at a seasonally adjusted annual rate, according to the Commerce Department, up roughly $770 billion from four years earlier
- In the last quarter of 2023, wealth held in stocks, real estate and other assets such as pensions reached the highest level ever observed by the Federal Reserve
It’s been a great time to be an investor, if you’ve tuned out the bearish calls, as interest rates increased.
Disposable income is being eroded, and changes are on the horizon. Nonetheless, anticipated rate cuts could support asset prices, making it premature to adopt a bearish stance. The last hike of the Fed’s tightening cycle occurred late last July, meaning that it has now been close to a year that the Fed has been on pause.
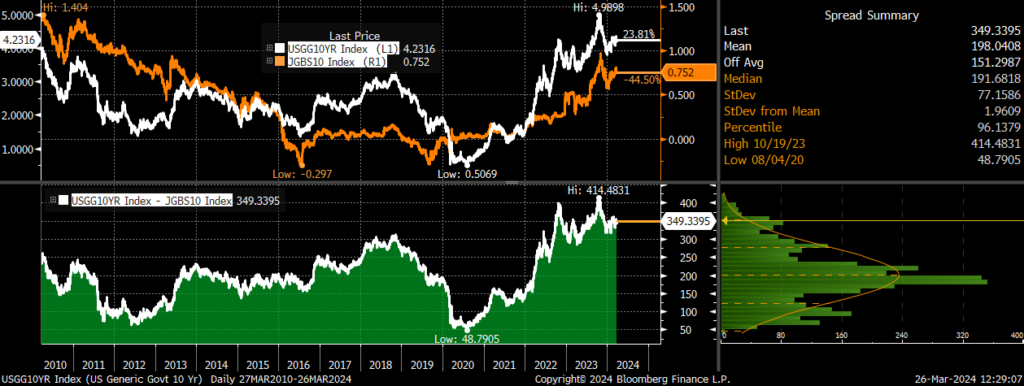
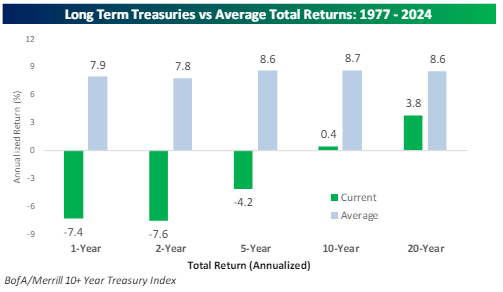
Rate cuts are expected to bolster retail and industrial stocks, as well as encourage the population to seek lower-rate mortgages for home upgrades. “Also, keep an eye on long term US Treasuries.
US Treasuries have delivered appalling returns in recent times.
Over the last year, the decline of -7.4% ranks just below the tenth percentile, relative to all other periods. If you think that’s bad, relative to history, two, five, ten, and twenty year returns, rank even worse relative to history. The fact that ten year returns for a ten-year treasury, are barely positive, is stunning when you think about it.
If we do get a rate cut on July 31, you can be certain more cuts are coming down the line. Long duration Treasury could be valuable hedge for any economic weakness that may be building up.
Source: Bespoke Invest
For specific stock recommendations and insights related to structured products, please don’t hesitate to reach out to me or your dedicated relationship manager.
Best wishes,

Manish Singh, CFA