

“Inflation is not all bad. After all, it has allowed every American to live in a more expensive neighbourhood without moving.”
Former US Senator Alan Cranston (June 19, 1914 – December 31, 2000)
Summary
Figures published by the US Labour Department on May 12, showed that the US Consumer Price Index (CPI) for April surged by the most in any 12-month period since 2008. This print is however being affected by what is known as the “base effect” – the effect that the choice of a basis of comparison or reference can have on the result of the comparison between data points. In this instance, the price crash for many goods and services in March and April 2020, as Covid-19 lockdowns took hold, has magnified the year-on-year change in consumer prices. If you compare the April 2021 CPI number to the print from two years ago i.e. April 2019, overall prices rose a more muted +2.2% in April, on an annualized basis, rather than the +4.2% headline number just published. The comparison over a two year period cuts out the “base effect” and gives a much more realistic reading of the change in prices. Due to generous fiscal help, the damage to demand as a result of the pandemic, has been limited and it has recovered quickly as retail sales have indicated. However, due to the reluctance of the workforce to return and some other supply-chain bottlenecks, the supply side is lagging. As soon as supply catches up, and it will, price rises will moderate. I therefore believe that we will see a short burst of high inflation, but over the medium-term, inflation is not a big risk.
The S&P 500 index has fully recovered from its two-day slump following the April CPI print and it continues to rally higher. While some fret over inflation, in reality we may be at the early stages of another Bull run in asset prices. So far, the inflation debate has mostly focused on the US. Europe, except for the UK, hasn’t featured much in the inflation debate. The UK economy, basking in the success of its vaccination program, is now expected to grow +8% this year and UK equities have rallied, although the FTSE 100 is still down by more than -10% from its all-time high. With benign inflation expectations in the Eurozone, supportive fiscal and monetary policies, export-dependent Eurozone stocks are primed for more gains as the world economy opens up. Overall, as global growth accelerates, inflation is rising but is not a concern. I therefore continue to be bullish on equities. Growth stocks will see-saw but sell-offs are an opportunity to “buy the dip” in good names.
A high inflation print in April, but will the sequels disappoint?
Any movie fan will tell you that sequels mostly disappoint, but this hasn’t stopped actors and producers from making sequels or even from hyping them. Take the case of Liam Neeson and the Taken movies. When asked about sequels, Neeson said “How many times can she be taken? I mean, that’s just bad parenting.” Yet, we got Taken, Taken 2 and Taken 3.
Figures published by the US Labour Department on May 12, showed that the US Consumer Price Index (CPI) for April surged by the most in any 12-month period since 2008. The CPI rose +4.2% from a year earlier, considerably higher than the +3.6% that had been expected and higher than +2.6% recorded for March. This has whetted the appetite of inflationistas who expect the CPI sequels to continue to print high. I am afraid, just like movie sequels, CPI sequels are also likely to disappoint.
The annual inflation print is currently being affected by what is known as the “base effect” – the effect that the choice of a basis of comparison or reference can have on the result of the comparison between data points. The price crash for many goods and services in March and April 2020, as Covid-19 lockdowns took hold and demand collapsed, has magnified the year-on-year change in consumer prices.
Furthermore, when you look at the internals of the April CPI print, you find a very steep rise in the price of car and truck rentals. Car and truck rentals surged +82% compared with April 2020 and airline fares leapt +9.6%. One reason that the used-car prices have surged so much is due to a global chip shortage that has reduced the production of new cars. According to research firm J.D. Power, that tracks car prices, the average price paid for a used car exceeded $25,000 in April for the first time in history. What is normally a depreciable asset, has been appreciating.
US CPI Urban Consumers used cars & trucks price increase (YoY%)
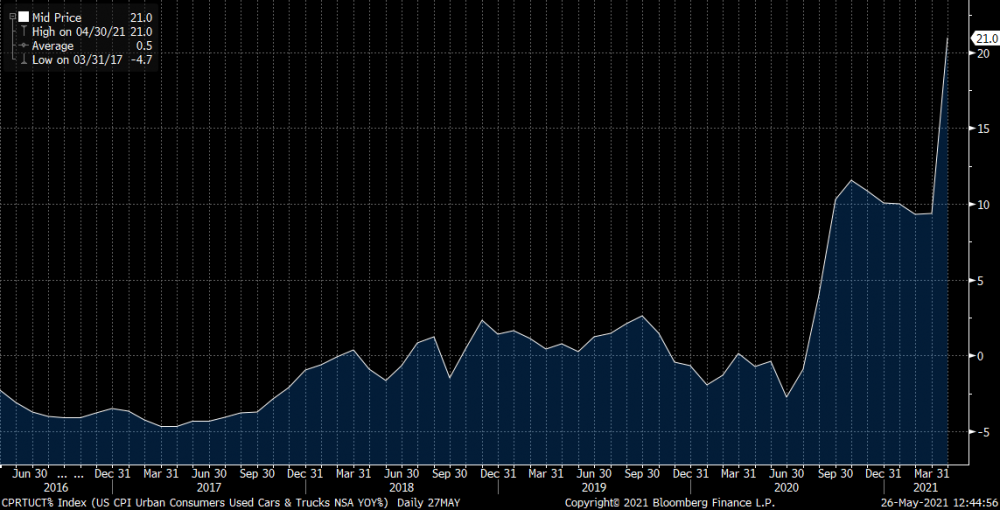
Source: Bloomberg
Car manufacturers have struggled, since last year, to keep up with customer demand as they recovered from Covid-19-related production stoppages and now face new supply-chain disruptions due to a chip shortage. According to car-shopping website TrueCar, US sales of used vehicles hit 3.4 million in April, up +58% from a year earlier. As the supply-chain improves, the price increase of used cars is bound to hurtle down and with it, the CPI.
Also, if you compare the April 2021 CPI print to the print from two years ago i.e. April 2019, overall prices rose a more muted +2.2% in April, on an annualized basis. The comparison over a two year period cuts out the “base effect” from April 2020 and gives a much more realistic reading of the change in prices. Due to generous fiscal help, the damage to demand has been limited and it has recovered quickly as retail sales have indicated. However, due to the reluctance of the workforce to return and some other supply-chain bottlenecks, the supply side is lagging. As soon as supply catches up, and it will, price rises will moderate.
As I highlighted in last month’s Market Viewpoints, we haven’t seen inflation concerns over the last three and half decades and each time inflation looked set to rear its head, the global economy encountered a disinflationary/deflationary event – for example: the collapse in oil prices (1986), the implosion of the Soviet Union (1989-91), the real estate and accompanying banking bust in Japan (1991), the Mexican Peso crisis (1994), the Asian financial crisis (1997-98), China’s entry into the World Trade Organization (2001), the US subprime mortgage bust (2008), the Eurozone crisis (2011-12) and the US shale revolution (2013 onwards).
Could the next disinflation/deflation event come from excessive automation? Or a China slowdown? Or other?
Visit any McDonald, KFC or Burger King and you will see fewer working staff and more automation. A recent Wall Street Journal (WSJ) report indicates that McDonald’s is designing voice-activated drive-throughs and robotic deep-fryers. Other chains are testing self-operating ovens and dishwashers, along with robots that flip burgers and perform other mechanical tasks.
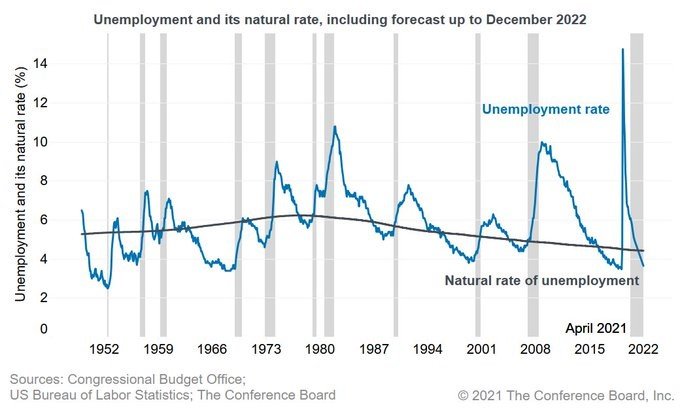
While it is not clear where the next disinflation/deflationary hit will come from, making a case for inflation in the absence of a clear external shock that alters supply or demand in a meaningful way is dangerous. Covid-19 was an external shock, but the recovery from it has been fairly quick, as the chart below from The Conference Board indicates. After the start of a recession, it typically takes the US economy about 4-7 years for unemployment to return to its natural rate. This time around, the unemployment rate may return to its natural rate by 2022 i.e. approximately two years after the start of the recession. We are yet to see any meaningful alteration in supply/demand due to pandemic shock and all signs point to a reversal to the mean.
On the basis of just one month CPI print, it’s hard to categorically say what is inflation, and what is just Covid-19 related supply-side and bottleneck related price rises. However, I am inclined to believe it’s the latter and it will sort itself out over the coming weeks as supplies come online. As I wrote in April’s Market Viewpoints – my gut tells me that we will see a short burst of high inflation, but over the medium-term, inflation is not a big risk.
The silver lining is the market has seen an over +4% print in US CPI, so it is conditioned to a high number. If the next monthly print is over +4% again, the market is unlikely to panic as much. On the other hand, if the next print is sub +4%, then expect the markets to rally and a sub +3.5% print will see an even stronger rally as the “inflation is transitory” theme starts taking hold. The S&P 500 index has fully recovered from its two-day slump following the April CPI print and it continues to rally higher.
It’s remarkable how closely the current bull run in US equities, that started in March 2020 is following the last bull run (March 2009- March 2011) we witnessed as the chart below indicates.
S&P 500 performance: Comparing the 2020-21 US equity Bull Run with the last one (2009-11)
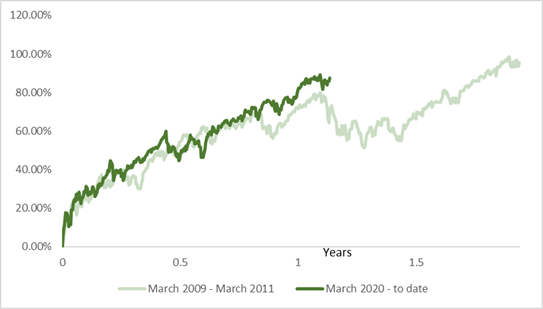
Source: Crossbridge Capital, Bloomberg
It took a once in half a century pandemic to bring the last Bull Run to an end. While some fret over inflation in reality we may be at early stages of another Bull run in asset prices. Ongoing fiscal and monetary accommodation, high rate of savings coming out of the pandemic, and a buoyant jobs market, all indicate higher consumer spending which will continue to fuel the rally in equities.
With government debt sky-high, both in the US and Europe, it’s unlikely we will see interest rates going up by much, even as tapering starts and eventually a rate rise will follow. I fully expect the “Japanification” of the US Treasury market. The need to sustain a high government debt level dominates monetary policy in Japan where the Bank of Japan now owns over 45% of the Japanese Government Bond (JGB) market. I see the US Federal Reserve (Fed) forced down this same path in the not too distant future. A cap on US bond yields will help growth stocks and equities in general.
Markets and the Economy
So far the inflation debate has mostly focused on the US. Europe, except for the UK, hasn’t featured much in the inflation debate.
The UK economy, basking in the success of its vaccination program, is now expected to grow +8% this year – the highest growth rate in the G7 group of advanced economies – fuelling the view that the Bank of England (BoE) may have to deal with inflation much sooner than either the Fed or the European Central Bank (ECB). Also, newly released data by the Office of National Statistics (ONS) of the UK, indicates that more than 5 million European (EU) nationals have chosen to stay in the UK post-Brexit, rather than the 3 million originally estimated. Recall, a portion of the economic hit to the UK was anticipated to come from departing EU workers. Therefore, this increase in EU nationals choosing to stay in the UK, is very positive news on the overall economic and consumer spending fronts.
The GBP/USD exchange rate hit 1.42 in May, as optimism rose rendering the Brexit naysayers wrong, once again. So far it seems that recovery and not inflation are the mantra, as Covid restrictions ease and push the benchmark FTSE 100 Index beyond the 7,000 level.
Despite the recent rally, the FTSE is still down by more than -10% from its all-time high set in May 2018. In comparison, both the S&P 500 index (SPX) and the EuroStoxx 50 (SX5E) indices are +24% and +5% higher than their previous cycle high in February 2020 respectively i.e. the FTSE rally has more to go. However, the upside to GBP/USD looks limited and it will likely not stay above the 1.45 level even if it were to get there.
Sticking with currencies for a moment, EUR/USD at 1.20 looks very rich and I do not expect it to have more upside despite the talk of USD weakness. At least with respect to GBP and EUR, the USD weakness has already played out for now.
In Europe – the Eurozone to be precise – although inflation and bond yields are ticking higher in the Eurozone, the levels are modest and the increases moderate. There is a broad agreement among economists and policymakers that as economies reopen, a combination of accelerating economic activity and “base effects” will push headline inflation above the ECB’s target of “below, but close to, 2%” and as with previous price rises over the last decade, inflation rise will prove short-lived.
As a result, while US stocks, particularly the technology heavy NASDAQ Index has faltered over the last two months, European stocks have prospered as the table below indicates. In fact, on a 12 months basis, Eurozone stocks returns – as measured by the CAC, SX5E, and the DAX – are now at par with NASDAQ returns, as also seen below.
Benchmark Equity Index Performance (2020, 2021 YTD, 1 year and since the March 2020 low)
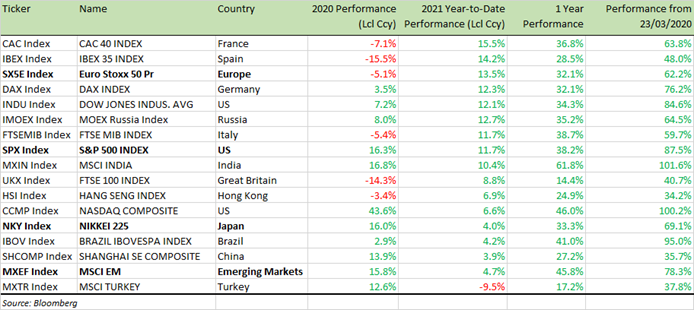
With benign inflation expectations in the Eurozone, supportive fiscal and monetary policy, export-dependent Eurozone stocks are primed for more gains as the world economy opens up.
Services-sector activity in the US and Europe—which includes restaurant dining, travel and entertainment—appear poised to continue expanding at a robust pace as government restrictions ease and consumers gain confidence in response to an acceleration in vaccinations. Preliminary results of surveys of Purchasing Managers Index (PMI) published last week by Markit showed that its index of activity at US services business rose to 70.1 in May, from 64.7 in April. A reading above 50 represents an expansion in activity.
PMIs suggest that Europe’s recovery may be more rapid. Activity in France’s services sector rose to 56.6 in May from 50.3 in April, a much larger increase than the rise to 52.5 that was forecast by many economists.
However, Japan’s services sector suffered a deeper contraction in May as the government there extended restrictions on the hospitality sector in areas including Tokyo and Osaka through the end of May. As a result, the Nikkei (NKY) fell by -10% early this month from its February levels.
Also worth noting is a sharp slowdown in factory output and retail sales in China as officials warned that the recovery in the world’s second-largest economy was running into headwinds.
The official Chinese data showed that factory output rose by +9.8% in April on the year, just below forecasts but slower than the +14.1% surge reported in March. Retail sales rose by +17.7%, far weaker than both the expected +25% and the +34.2% rise in March.
Benchmark US equity sector performance (2020, 2021 YTD and since March 2020 low)
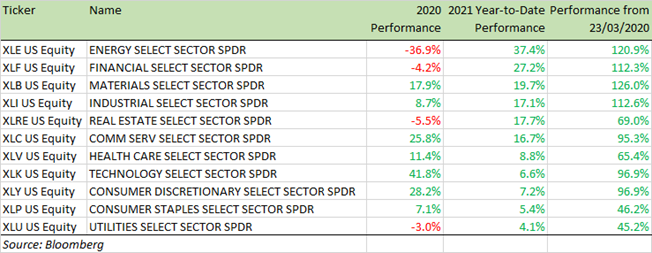
Technology and Services stocks in the US got hit by the rise in inflation and inflation expectations and there is no better measure of inflation fear than in bond yields. As inflation expectations rose, the 10Y US Treasury yield hit +1.5% in early March, reaching +1.7% by mid-march. Despite a high inflation print in May, the 10Y bond yield is not rising anymore, and has traded in a narrow range of 1.5%-1.7% as economic data have remained mixed.
Growth stocks that were sold on fear of inflation are slowly being bought back and if the next CPI print is +3.5% or below, you will see a big rally in growth names.
In summary, therefore, monetary and fiscal accommodation continues across the globe as growth accelerates. Inflation is rising but is not a concern. Supply side bottlenecks are being addressed. I continue to be bullish on equities. Growth stocks will see-saw but sell-offs are an opportunity to “buy the dip” in good names. My favourite sectors to pick stocks from – Consumer Discretionary (XLY), Healthcare (XLV), Technology (XLK) and Communications (XLC). Technology stocks continue to deliver stellar earnings, despite the rising yield curve concerns.
For specific stock recommendations, please do not hesitate to get in touch.
Best wishes,

Manish Singh, CFA