

“The difficulty lies, not in the new ideas, but in escaping from the old ones.”
John Maynard Keynes
Summary
Despite slightly hawkish central banks of late, equity markets have continued their upward trajectory and bond yields have fallen. The yield on 10 and 30-year US Treasurys, is now back at the levels seen last February. Whilst inflation may not yet be showing up or may not show up for a while, it has however already achieved an important goal– raising inflation expectations and thus taking the risk of deflation off the table for few years. The US Federal Reserve has had its foot on the gas since the COVID pandemic started and it is getting ready to take it off ever so slightly. The Fed is however not ready to put the brakes on yet, and rightly so, as the “Delta variant” of Covid-19 rages on and the vaccination rate is still very low in many parts of the world, particularly in Asia and Emerging Markets.
As per a recent report in The Wall Street Journal, the greatest wealth transfer in history has begun. The “Baby boomer” generation has started parcelling out wealth to their heirs and others, unleashing a torrent of economic activity. Older generations will hand down some $70 trillion between 2018 and 2042. A good percentage of this will be “spent” to meet living, leisure, and luxury expenses and that means GDP expansion, job creation and business growth.
The S&P 500 index has steadily rallied in the last 15 months and each quarter has seen a rally of more than +5%. A gain of +5% in any quarter is impressive enough, but five quarters in a row is almost breath-taking. The only other period to match the current streak was in the five quarters ending in December 1954.
Approximately $580bn has been added to global equities funds in the first half of 2021. This inflow surpasses the cumulative inflow to global equity fund during all the previous 20 years. Far too many people focus on levels of the markets and miss out reading the structural changes that are happening in the economy and the markets, that have long-lasting impact. Many fall into the trap of thinking an “all-time high “ means a correction is on the way. Whilst some fret over inflation, in my view, we may be in the early stages of another Bull Run in asset prices.
The case for Inflation has weakened but be happy the risk of deflation is off the table
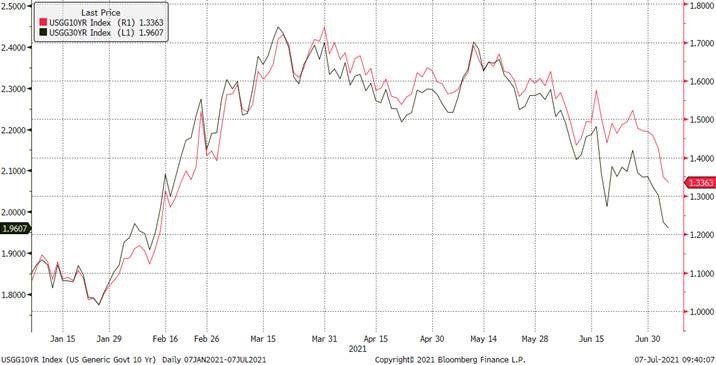
The yield on the 10 year and 30-year US Treasurys (chart below) is now back to the levels seen last February i.e. the inflation narrative priced in over the last three months has been unwound, and then some.
Cynics may say –inflation, what inflation?
Whilst inflation may not be showing up yet or may not show up for a while, it has however already achieved an important goal– raising inflation expectations and thus taking the risk of deflation off the table for few years. This must be applauded. You will recall, not so long ago, central banks were more concerned about the potential “deflation” risk. Deflation is catastrophic for asset markets, as history and the more recent experience in Japan have demonstrated.
As I wrote in May Market Viewpoints I don’t discount the risk of inflation fully. In fact, we may yet see a short burst of high inflation driven by wages (though it’s not the 1970s when the impact of labour unions on wages was considerable), or indeed because of an increase in Oil prices , however, over the medium-term, inflation is not a big risk. As outlined in the April Market Viewpoints – the last 250 years of US inflation can be summarised as – a very long period of little or no inflation, a couple of decades of high inflation in the 1970s-80 and back to more than three decades of low inflation. Inflation will be tame because of structural reasons and technology’s disinflationary impact will bear on the world for many years to come.
6 months chart: US Treasury 10Y and 30Y yield
Source: Bloomberg
It seems that US economic growth may also be peaking.
The US economy has been on a tear. It expanded at an annualized rate of +6.4% in the first quarter of 2021 and the growth in the second quarter should be even higher, as the economic re-opening has accelerated. No doubt, the bipartisan Infrastructure Bill to spend $1.2 trillion on roads and bridges will be a further boost to growth. However, more recent US economic data indicates that we may have seen the top of the US growth cycle, as the re-opening exuberance fades.
According to the current estimate of the Federal Reserve Bank of Atlanta, GDP growth in the second quarter should be +7.8%. This reading is down from +8.6% on July 1, +10% in June and +12% in May.
The marginal gain from further re-opening is likely to moderate, as most US states are now largely open and data from the Transportation Security Administration (TSA) shows that the number of Americans passing through airports actually surpassed pre-pandemic levels at some points over the July 4 long weekend. Some 2.15 million people passed through security checkpoints on Thursday and 2.2 million on Friday last week, versus 2.09 million and 2.18 on the same days in 2019. The rebound of travel follows the plummeting of coronavirus-linked cases, hospitalizations and deaths in the United States. Nearly 60% of American adults are at least partially vaccinated.
If the growth in the US has peaked, then that is good news for the equity markets. The fear of a spike in inflation will recede and the US Federal Reserve (Fed) will be under less pressure to tighten monetary policy.
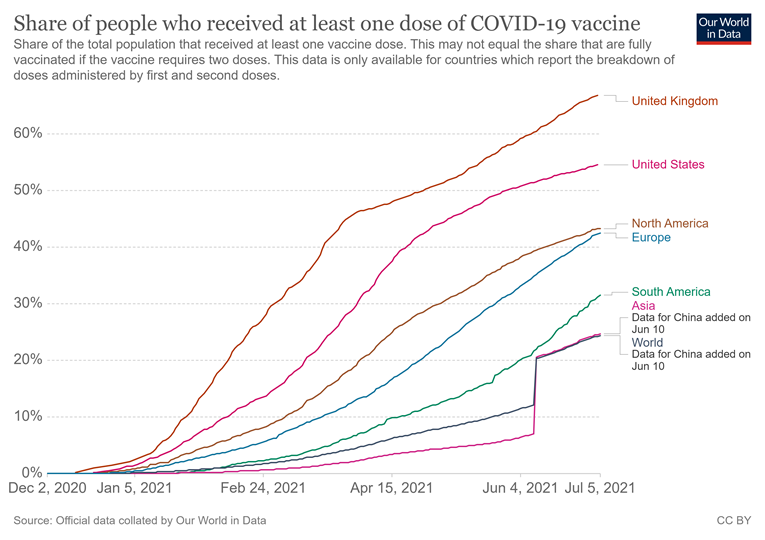
The UK has the highest vaccination rate among the G20 group of economies and yet the number of confirmed cases of Covid-19 is now back up to 25,000 per day, a rate last seen in February this year. Over 90% of these cases are that of the Delta variant. The Delta variant is far more contagious and is therefore spreading rapidly. However, very encouragingly, the number of deaths is down from 600 per day in February to less than 20 per day now i.e. a reduction of -96%.
The vaccine is working and, the higher the vaccination rate, the sooner things will get back to normal. Until then, central banks will be in no rush to taper their asset purchases with anything other than a token amount. As things stand, the Fed and the European Central Bank (ECB) are still buying assets at the rate of $120 billion and €100 billion per month respectively. So, while the guidance has been adjusted at the margins by the Fed, the printing presses in the US and Europe are still whirring and increasing fiat money supply at an annual rate of $2.8 trillion.
Markets and the Economy
It is no surprise therefore that equity markets have continued to increase. Inflation fears seem to have done little to dampen the spirit of equity investors.
Approximately $580bn has been added to global equities funds in the first half of 2021. This inflow surpasses the cumulative inflow to global equity fund during all the previous 20 years, according to data provider EPFR. The S&P 500 (SPX) is up more than +15% this year, while the FTSE All-World Index has gained slightly more than +12%.
So we’ve had slightly hawkish central banks and still equity markets have been going up and bond yields have fallen. Far too many people have focused on levels of the markets and miss out on the changes going on around us. Many fall into the trap of thinking an all-time high (ATH) means a correction is ion the way.
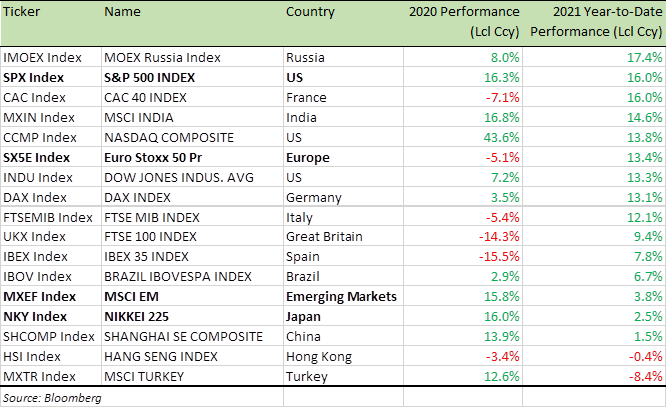
Benchmark Equity Index Performance (2020, 2021 YTD)
After the worst quarter for US equities since the Financial Crisis of 2007/8, during the first quarter of 2020, the SPX has steadily rallied in the last 15 months and each quarter has seen a rally of more than +5%. A gain of +5% in any quarter is impressive enough, but five quarters in a row is almost breath-taking. The only other period to match the current streak was in the five quarters ending in December 1954. Besides this streak, there were three other periods when the SPX has rallied by more than +5% for four consecutive quarters (1958, Q3 1982- Q2 1983 and 1995).
So what happened to equity markets in 1955, in the quarter that followed that fifth straight quarter of gains, I hear you ask? Well, the SPX didn’t rally more than +5%, but it was up a respectable +1.7%. For the entire year that followed the five-quarter streak, the SPX added another +26.4% (chart below)
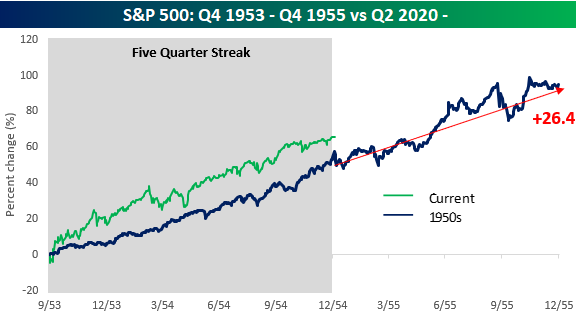
Source: Bespoke Invest
So what were the factors that contributed to the 1954-55 rally in equities? The events that led up to it have some similarities to the current period. Then, as the US struggled to finance World War II, the Fed kept interest rates low to reduce borrowing costs. The Fed did so through the purchase of Government securities, even as inflation levels surged. Naturally, when the war was over, President Harry Truman and his Treasury Secretary John Snyder argued for a continuation of the Fed’s easy policy. What politicians wouldn’t?
This time around, the pandemic has had a similar impact on Fed’s monetary policy and Chairman Powell who has already faced pressure from then President Donald Trump to cut rates and keep interest rates low, may yet find it difficult to get out of the “low rate” policy as debt and deficits continue to mount to fund President Joseph Biden’s spending plans.
The chart below compares the current bull run in US equities, that started in March 2020 to the last bull run (March 2009- March 2011) we witnessed. The current bull run looks even better and stronger and there is no sign of a dip.
S&P 500 performance: Comparing the 2020-21 US equity Bull Run with the last one (2009-11)
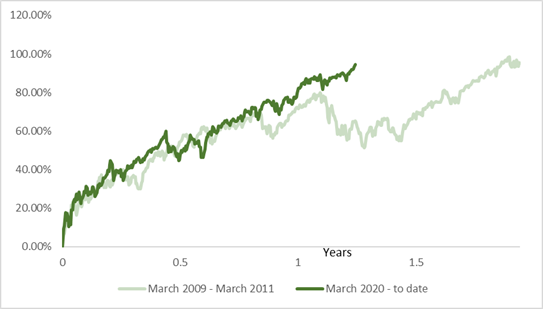
Source: Crossbridge Capital, Bloomberg
It took a once in half a century pandemic to bring the last Bull Run to an end. While some fret over inflation, in reality we may be at the early stages of another Bull Run in asset prices. Ongoing fiscal and monetary accommodation, a high rate of savings coming out of the pandemic, and a buoyant jobs market, all indicate higher consumer spending which will continue to fuel the rally in equities.
Add to that these startling statistics published in The Wall Street Journal (WSJ)
- Baby boomers and older Americans have spent decades accumulating an enormous stockpile of money. At the end of this year’s first quarter, Americans age 70 and above had a net worth of nearly $35 trillion. That amounts to a whopping 27% of all US wealth, up from 20% three decades ago. Their wealth is equal to 157% of US GDP, more than double the proportion 30 years ago
- The greatest wealth transfer in history has begun as boomers started parcelling it out to their heirs and others, unleashing a torrent of economic activity including buying homes, starting businesses and giving to charity. Older generations will hand down some $70 trillion between 2018 and 2042, according to research and consulting firm Cerulli Associates
Of course, some of this wealth will be saved or invested, but a good percentage will be “spent” to meet living, leisure, and luxury expenses and that means GDP expansion, job creation and business growth.
It’s too easy to be bearish. Some people even have it as their base case and relish reminding everyone “I told you so” at every piece of negative news. Sadly for them, however, their much-awaited -20% correction often comes after +100% rallies.
It’s a fact that “most people would rather be in the majority, than be right” and when the media highlights doom and gloom it becomes that much easier to be a bear than a bull and find yourself in minority as I have found myself through the last bull run and this one. Yes, there will be market corrections but “Time in the market” holding assets you have researched, will always beat “Timing the market.”
Investing is as much about knowledge, forecasting as it is about psychology. If you are bearish and overindulge, you get anchored to bearish views and start seeking echo chambers full of other bears. It doesn’t take long thereafter to lose sight of reality and you completely miss the structural changes happening in the economy and the markets that has long-lasting effects. A John Maynard Keynes quote to bear in mind – “The difficulty lies, not in the new ideas, but in escaping from the old ones.”
Benchmark US equity sector performance (2020, 2021 YTD)
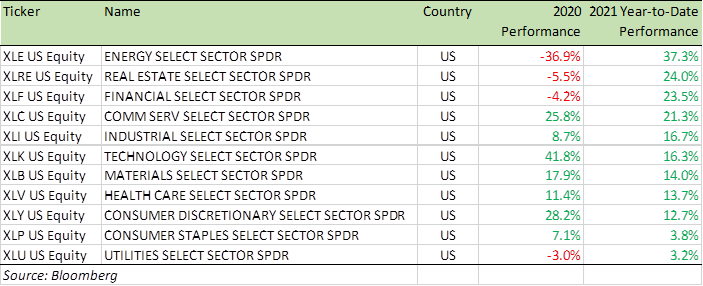
As you may have guessed by now, I continue to be bullish on growth and US equities and I do not see inflation as a major concern. I see central banks pulling away support in a very steady manner and interest rate rises, when they come, will be very gradual and hit a low plateau soon.
European equities still have a long way to catch up and I would caution against underestimating the changes going on in the Euro group. Italian Prime Minister Mario Draghi has established himself as the leading light, given his background and experience. As the only macroeconomic expert in the G7 leader group, he far outshone Chancellor Angela Merkel of Germany and President Emmanuel Macron of France at the recently concluded G7 meeting in Cornwall. Draghi is driving the European Union (EU) towards higher debt and higher deficit and this will be funded by more money printing by the ECB and borrowing using the EU Recovery Fund.
The first syndicated issuance by the EU recovery Fund saw a demand of €142 billion for the €20 billion inaugural issue EU’s 10-year bond offer. The EU Commission had to pay interest below 1%. By the end of 2026, the EU recovery Fund plans to raise around €800 billion. The money raised will back grants and loans to EU member states to help their economies recover from the Covid-19 crisis.
Austerity is well and truly over in the EU and spending will carry on. Of course, there will be a day of reckoning as both the EU and the Euro are structurally flawed. However, such flaws usually take a long time to unravel. The political will should never be underestimated and a flood of money can keep the market forces at bay for longer than one anticipates.
For specific stock recommendations, please do not hesitate to get in touch.
Best wishes,

Manish Singh, CFA